Bullish Harami
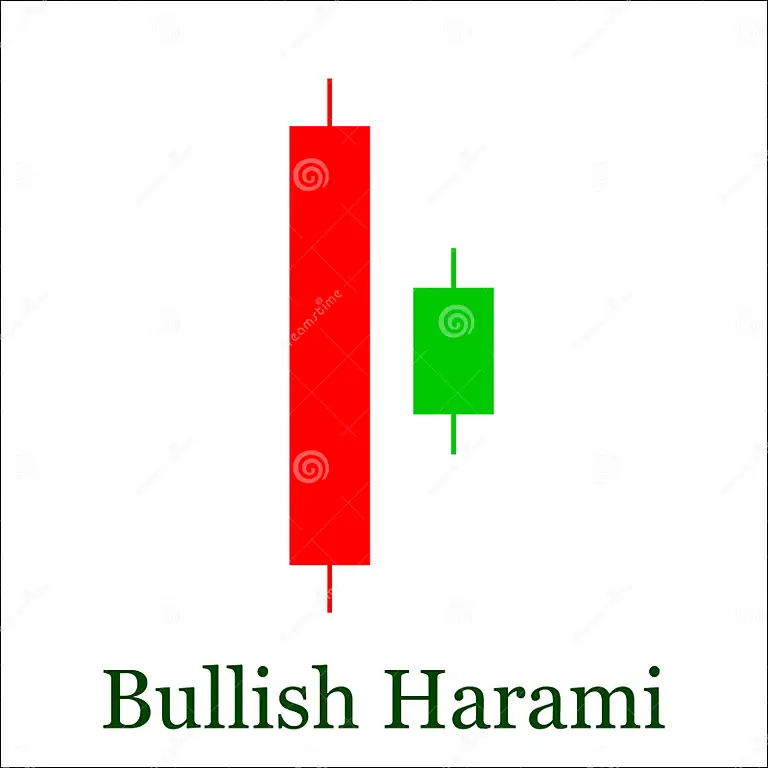
The bullish harami is a two-candlestick reversal pattern that signals a potential rise in price. It is formed when a large bearish candle is followed by a smaller bullish candle that is contained within the body of the first candle.
The pattern is more reliable when it occurs after a strong downtrend.
Here are some tips for trading the bullish harami pattern:
- Look for the pattern to form after a strong downtrend.
- The second candle should be smaller than the first candle.
The bullish harami pattern is a useful tool for traders who are looking to buy the market. However, it is important to remember that no single pattern is 100% reliable, and traders should always use caution when trading.
These stocks have formed a Bullish Harami Pattern on 1 Day time frame
| Company Symbol | Sector | Price | Change | Volume | 52wk High | 52wk High | 1Y Beta | P/E | M Cap | Rating |
|---|---|---|---|---|---|---|---|---|---|---|
| AJMERA | Finance | 359.20 | 4.05 (1.14%) | 29,775 | 414.30 | 232.90 | 1.49 | 15.74 | 12.6 B | Sell |
| KHAITANLTD | Consumer Durables | 54.50 | 0.50 (0.93%) | 43 | 73.80 | 37.45 | 0.24 | 18.80 | 253.7 M | Sell |
| PREMIERPOL | Non-Energy Minerals | 103.85 | 1.40 (1.37%) | 5,025 | 130.00 | 69.35 | 1.20 | 15.26 | 2.2 B | Sell |