Hanging Man
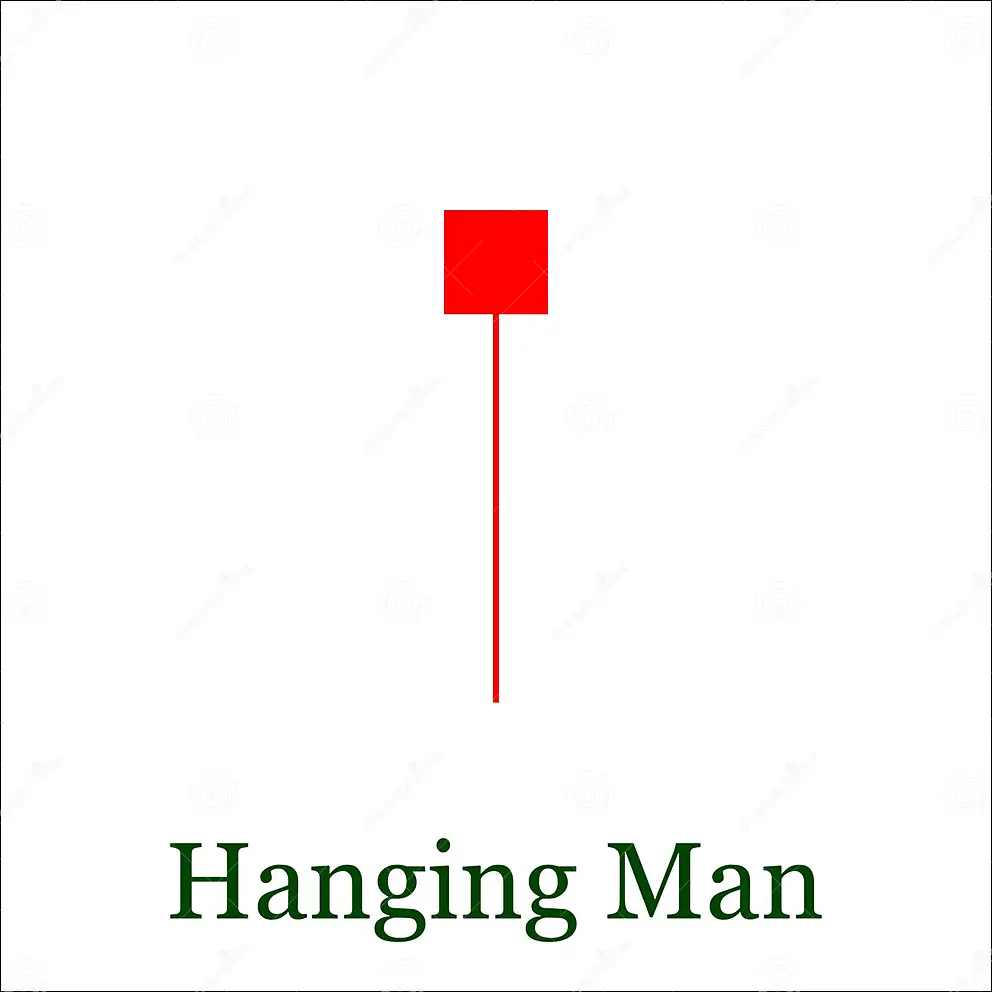
The hanging man is a bearish reversal candlestick pattern that occurs after an uptrend. It is characterized by a small body and a long lower shadow. The long lower shadow indicates that there was a lot of selling pressure during the day, but the buyers were able to push the price back up to the opening price. The hanging man is considered to be a bearish signal, but it should be used in conjunction with other technical indicators to confirm the pattern.
Here are some tips for trading the hanging man pattern:
- Look for the pattern to form after a strong uptrend.
- Wait for the price to close below the open of the hanging man before entering a short position.
The hanging man is a useful tool for traders who are looking to short the market, but it is important to remember that no single pattern is 100% reliable, and traders should always use caution when trading.
These stocks have formed a Hanging Man Pattern on 1 Day time frame
| Company Symbol | Sector | Price | Change | Volume | 52wk High | 52wk High | 1Y Beta | P/E | M Cap | Rating |
|---|---|---|---|---|---|---|---|---|---|---|
| AARTISURF | Process Industries | 651.80 | -1.85 (-0.28%) | 15,805 | 886.47 | 418.05 | 1.54 | 35.66 | 5.5 B | Strong Buy |
| UMESLTD | Producer Manufacturing | 5.90 | 0.25 (4.42%) | 58,050 | 8.00 | 3.05 | 2.06 | 213.00 | 151.1 M | Buy |