Hammer
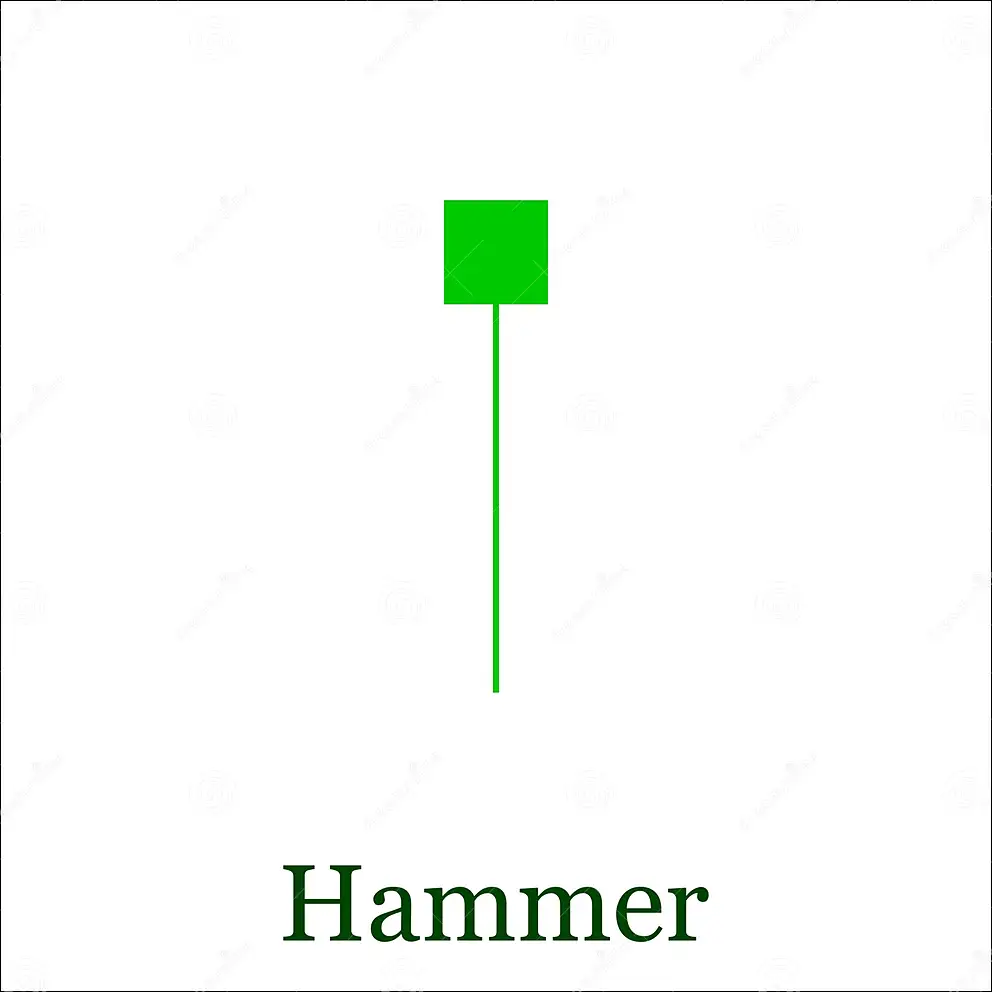
The hammer is a bullish reversal candlestick pattern that occurs at the bottom of a downtrend. It is characterized by a small body and a long lower shadow. The long lower shadow indicates that there was a lot of selling pressure during the day, but the buyers were able to push the price back up to the opening price.
The hammer is considered to be a reliable signal of a trend reversal, but it should be used in conjunction with other technical indicators to confirm the pattern.
Here are some tips for trading the hammer candlestick pattern:
- Look for the pattern to form after a strong downtrend.
- Wait for the price to close above the open of the hammer before entering a long position.
The hammer is a useful tool for traders who are looking to buy the market, but it is important to remember that no single pattern is 100% reliable, and traders should always use caution when trading.
These stocks have formed a Hammer Pattern on 1 Day time frame
| Company Symbol | Sector | Price | Change | Volume | 52wk High | 52wk High | 1Y Beta | P/E | M Cap | Rating |
|---|---|---|---|---|---|---|---|---|---|---|
| MANORG | Process Industries | 386.55 | 0.55 (0.14%) | 2,248 | 665.00 | 306.95 | 1.68 | 3.3 B | Sell |