Long Lower Shadow
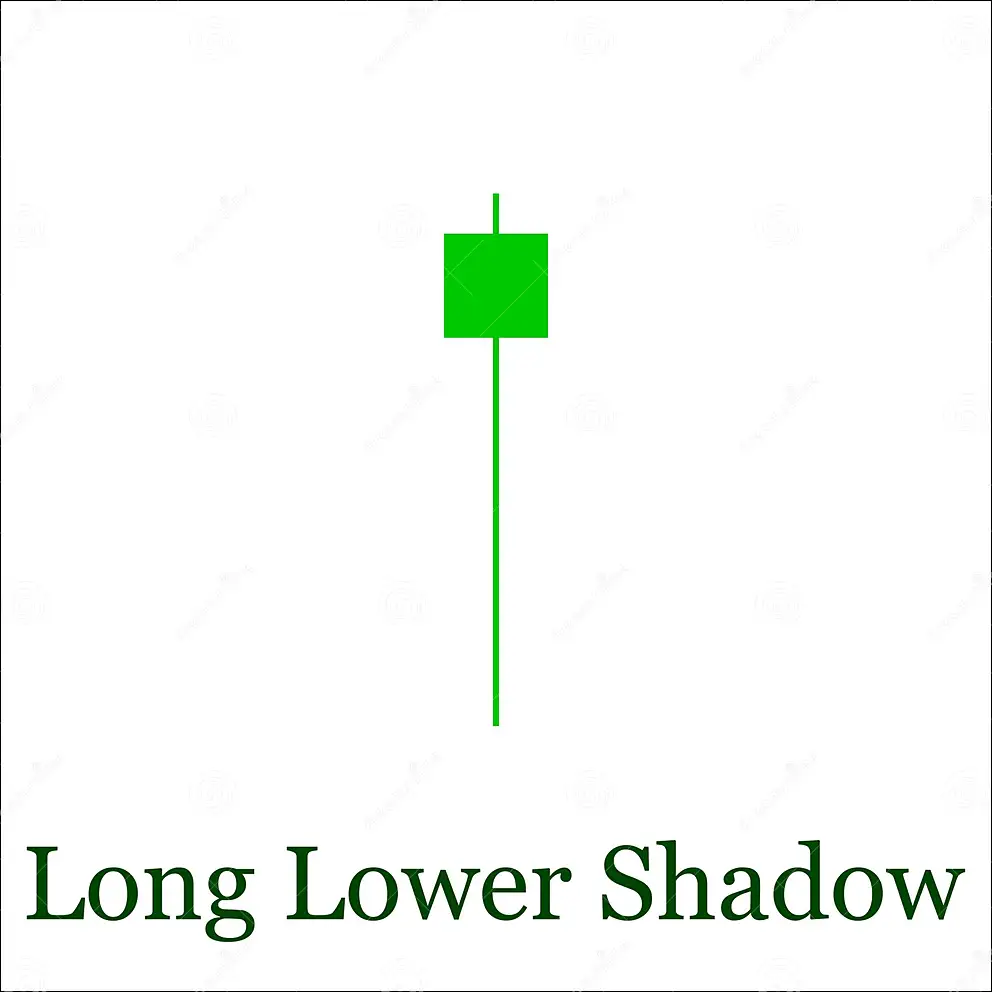
A long lower shadow candlestick is a candlestick with a small body and a long wick or shadow that extends below the body. This indicates that there was a lot of selling pressure during the day, but the buyers were able to push the price back up to the opening price.
The long lower shadow candlestick pattern can be interpreted as a sign of bullishness or bearishness, depending on the context in which it appears. It is more likely to be interpreted as bullish if it appears after a long downtrend, and more likely to be interpreted as bearish if it appears after a long uptrend.
The long lower shadow candlestick pattern should be confirmed by other technical indicators, such as moving averages and momentum indicators.
These stocks have formed a Long Lower Shadow Pattern on 1 Day time frame
| Company Symbol | Sector | Price | Change | Volume | 52wk High | 52wk High | 1Y Beta | P/E | M Cap | Rating |
|---|---|---|---|---|---|---|---|---|---|---|
| ADVENZYMES | Consumer Non-Durables | 323.10 | 2.15 (0.67%) | 180 T | 346.55 | 225.00 | 1.13 | 30.99 | 35.9 B | Buy |
| AVG | Transportation | 301.35 | 6.35 (2.15%) | 201.7 T | 305.00 | 99.95 | -0.24 | 3.5 B | Strong Buy | |
| BEARDSELL | Process Industries | 33.90 | 1.25 (3.83%) | 17,322 | 37.70 | 17.00 | 1.94 | 13.64 | 1.3 B | Buy |
| BRITANNIA | Consumer Non-Durables | 4,564.65 | 6.10 (0.13%) | 210.8 T | 5,270.35 | 3,690.00 | 0.64 | 45.03 | 1.1 T | Buy |
| CUBEXTUB | Non-Energy Minerals | 47.70 | 0.75 (1.60%) | 47,763 | 52.00 | 24.25 | 1.86 | 23.69 | 670.8 M | Buy |
| DODLA | Consumer Non-Durables | 683.70 | 3.55 (0.52%) | 47,874 | 898.90 | 431.20 | 0.81 | 30.98 | 40.3 B | Sell |
| IRFC | Finance | 75.10 | 0.65 (0.87%) | 94.9 M | 92.35 | 20.80 | 2.01 | 15.75 | 972.7 B | Buy |
| JISLDVREQS | Producer Manufacturing | 31.45 | 0.45 (1.45%) | 28,070 | 40.55 | 15.25 | 0.41 | 39.1 B | Neutral | |
| KANANIIND | Consumer Durables | 8.05 | 0.10 (1.26%) | 62,056 | 13.45 | 5.50 | 1.65 | 64.09 | 792.5 M | Strong Buy |
| MANKIND | Health Technology | 1,751.80 | 12.00 (0.69%) | 123,106 | 1,949.00 | 1,242.00 | 0.83 | 697.1 B | Sell | |
| MITCON | Commercial Services | 79.50 | 1.70 (2.19%) | 2,992 | 94.95 | 53.05 | 18.02 | 1 B | Neutral | |
| NCLIND | Non-Energy Minerals | 220.40 | 1.05 (0.48%) | 68,231 | 246.55 | 157.00 | 0.04 | 15.62 | 9.9 B | Neutral |
| NLCINDIA | Utilities | 129.90 | 0.60 (0.46%) | 1.2 M | 147.60 | 65.00 | 1.88 | 14.54 | 179.2 B | Sell |
| OPTIEMUS | Distribution Services | 310.85 | 1.65 (0.53%) | 159.8 T | 381.45 | 160.30 | 1.23 | 58.02 | 26.7 B | Buy |
| PGEL | Electronic Technology | 1,774.55 | -3.00 (-0.17%) | 54,280 | 2,143.95 | 955.55 | 0.32 | 42.73 | 46.2 B | Neutral |
| PIDILITIND | Process Industries | 2,517.70 | 4.85 (0.19%) | 348.4 T | 2,843.75 | 2,250.05 | 0.58 | 92.28 | 1.3 T | Neutral |
| PRECWIRE | Producer Manufacturing | 121.85 | -0.55 (-0.45%) | 1.1 M | 127.20 | 53.67 | 1.63 | 36.22 | 21.9 B | Buy |
| REDINGTON | Electronic Technology | 157.75 | 0.25 (0.16%) | 1.3 M | 202.30 | 135.00 | 1.07 | 9.30 | 123.2 B | Sell |
| SEJALLTD | Process Industries | 229.85 | -0.05 (-0.02%) | 1,845 | 288.95 | 210.10 | 0.40 | 30.92 | 2.3 B | Buy |
| SURANASOL | Electronic Technology | 24.00 | 0.20 (0.84%) | 76,876 | 31.50 | 14.70 | 1.22 | 189.57 | 1.2 B | Neutral |
| TAJGVK | Consumer Services | 231.50 | 0.75 (0.33%) | 51,720 | 286.15 | 168.95 | 1.78 | 16.01 | 14.5 B | Sell |
| TASTYBITE | Consumer Non-Durables | 16,138.55 | 190.40 (1.19%) | 1,092 | 19,791.95 | 7,961.00 | 0.89 | 94.60 | 40.8 B | Neutral |
| TATACHEM | Process Industries | 1,035.80 | 1.00 (0.10%) | 486.8 T | 1,214.90 | 876.80 | 1.10 | 11.68 | 263.6 B | Neutral |
| TIMETECHNO | Process Industries | 154.80 | -0.85 (-0.55%) | 1.5 M | 161.00 | 69.40 | 1.51 | 15.22 | 35.1 B | Buy |
| UFLEX | Process Industries | 439.50 | 3.20 (0.73%) | 92,080 | 749.00 | 325.10 | 1.14 | 31.5 B | Neutral | |
| VETO | Producer Manufacturing | 131.95 | -0.90 (-0.68%) | 185.1 T | 147.00 | 71.45 | 1.12 | 13.65 | 2.5 B | Buy |
| WEALTH | Finance | 312.95 | 2.25 (0.72%) | 787 | 399.40 | 214.25 | 0.86 | 16.06 | 3.3 B | Sell |