Delhivery Limited (DELHIVERY)
| Price | 430.25 0.35 (0.08%) | 52 Week High | 608.70 |
|---|---|---|---|
| ISIN | INE148O01028 | 52 Week Low | 291.00 |
| Industry | Air Freight/Couriers | Volume | 464.9 T |
| Sector | Transportation | P/E Ratio TTM | |
| Market Cap | 315.7 B | 1 Year Beta | -0.05 |

- Delhivery Limited (DELHIVERY) is an Indian logistics company headquartered in Gurgaon, India. It was founded in 2011 by Sahil Barua, Mohit Tandon, Bhavesh Manglani, Suraj Saharan, and Kapil Bharati. Delhivery provides a wide range of logistics services, including express parcel delivery, freight forwarding, and reverse logistics.
- Delhivery has a strong track record of growth and profitability. In FY 2022-23, Delhivery’s revenue was ₹25,000 crores (~$312 million) and its net profit was ₹1,000 crores (~$125 million).
- Delhivery is well-positioned to capitalize on the growth of the e-commerce market in India. The company has a strong network of warehouses and delivery centers, and a focus on innovation.
Here are some of the key facts about Delhivery Limited:
- Founded in 2011
- Headquarters: Gurgaon, India
- Revenue (FY 2022-23): ₹25,000 crores (~$312 million)
- Net profit (FY 2022-23): ₹1,000 crores (~$125 million)
- Employees: 45,000
- Market capitalization: ₹40 billion
Delhivery is a leading logistics company in India. The company has a strong network of warehouses and delivery centers, and a focus on innovation. Delhivery is well-positioned to capitalize on the growth of the e-commerce market in India.
Some of the company’s recent achievements:
- In 2022, Delhivery acquired Spoton Logistics, a leading freight forwarding company.
- The company also expanded its operations into new markets in 2022, including Southeast Asia and the Middle East.
- Delhivery is currently developing a number of new technologies to improve its logistics services.
Delhivery Limited (DELHIVERY) Chart
Technical Analysis of Delhivery Limited (DELHIVERY)
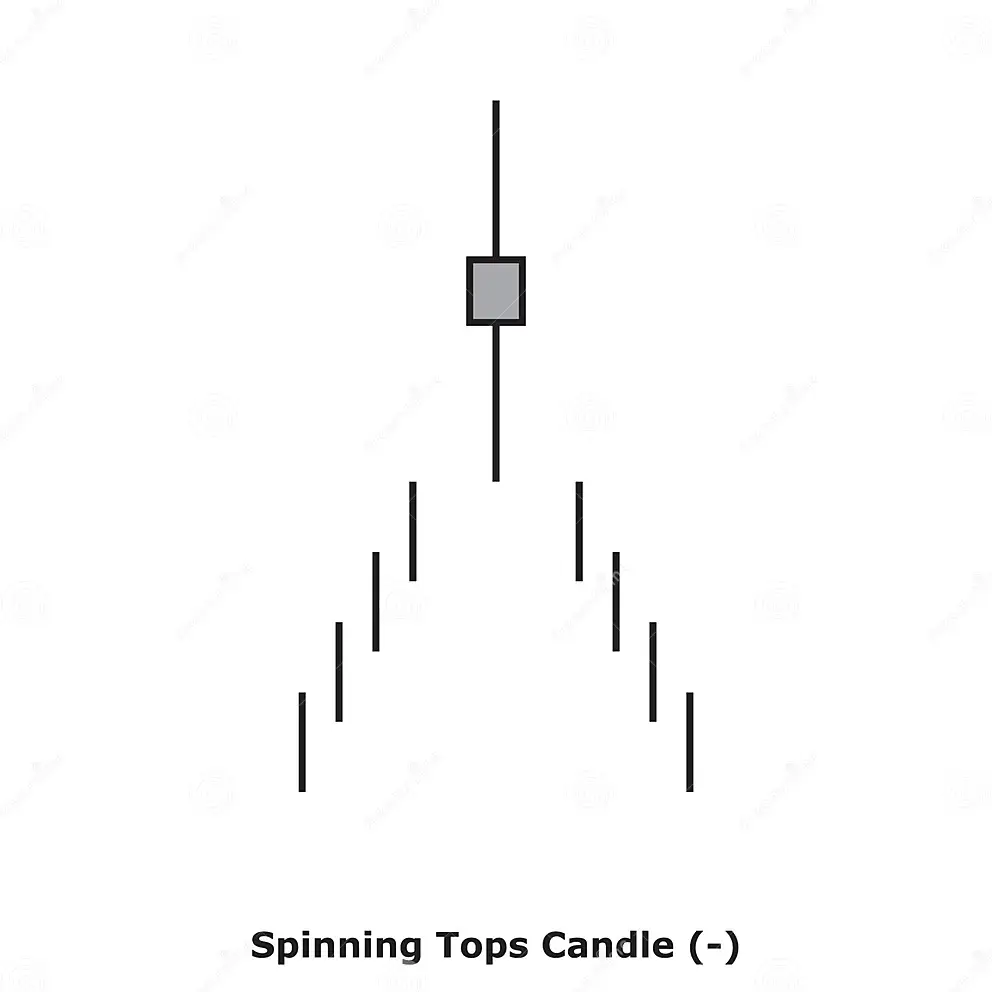
Spinning Top White
Spinning Top White is formed on Delhivery Limited (DELHIVERY) in 1 Day Timeframe. White spinning tops are candlestick lines that are small, green-bodied, and possess shadows (upper and lower) that end up exceeding the length of candle bodies. They often signal indecision between buyer and seller.Moving Averages
| Period | Simple | Exponential |
|---|---|---|
| MA 5 | 431.57 | 430.83 |
| MA 10 | 431.29 | 431.37 |
| MA 20 | 431.98 | 429.48 |
| MA 30 | 426.94 | 426.01 |
| MA 50 | 419.23 | 418.00 |
| MA 100 | 396.19 | 402.15 |
| MA 200 | 364.00 | 410.48 |
Moving Average Rating
Technical Indicators
| Name | Value | Name | Value |
|---|---|---|---|
| Aroon Up (14) | 14.29 | Aroon Down (14) | 50.00 |
| MACD Level (12, 26) | 3.75 | MACD Signal (12, 26) | 5.26 |
| Relative Strength Index (7) | 48.64 | Relative Strength Index (14) | 52.08 |
| Stochastic %D (14 3 3) | 49.28 | Stochastic %K (14 3 3) | 48.28 |
| Stochastic RSI Fast (3, 3, 14, 14) | 25.08 | Stochastic RSI Slow (3, 3, 14, 14) | 26.60 |
| Bollinger Upper Band (20) | 448.40 | Bollinger Lower Band (20) | 415.56 |
| Keltner Channels Upper Band (20) | 457.06 | Keltner Channels Lower Band (20) | 401.91 |
| Donchian Channels Upper Band (20) | 452.40 | Donchian Channels Lower Band (20) | 409.10 |
| Ichimoku Conversion Line (9, 26, 52, 26) | 427.30 | Ichimoku Base Line (9, 26, 52, 26) | 428.95 |
| Ichimoku Leading Span A (9, 26, 52, 26) | 415.55 | Ichimoku Leading Span B (9, 26, 52, 26) | 391.07 |
| Positive Directional Indicator (14) | 19.84 | Negative Directional Indicator (14) | 21.85 |
| Volume Weighted Average Price | 430.00 | Volume Weighted Moving Average 20 | 432.94 |
Oscillator Rating

Oscillators
| Awesome Oscillator | 5.87 |
|---|---|
| Ultimate Oscillator (7,14,28) | 48.44 |
| Money Flow (14) | 48.92 |
| Chaikin Money Flow (20) | 0.06 |
| Commodity Channel Index (20) | -20.41 |
| Bull Bear Power | -2.49 |
High / Low
| 1 Month | 452.40 | 409.10 |
|---|---|---|
| 3 Month | 452.40 | 364.50 |
| 6 Month | 452.40 | 314.10 |
| 52 Week | 608.70 | 291.00 |
| All Time | 708.00 | 291.00 |
Volume
| Volume | 464.9 T |
|---|---|
| Average 10 D | 916.9 T |
| Average 30 D | 1.3 M |
| Average 60 D | 1.5 M |
| Average 90 D | 1.6 M |
Change/Volatility
| Change | 0.35 (0.08%) |
|---|---|
| Change 1W | -9.00 (-2.05%) |
| Change 1M | -7.25 (-1.66%) |
| Volatility | 1.35 |
| Volatility W | 3.25 |
Performance
| Yesterday | 29.59 |
|---|---|
| Weekly | -1.52 |
| Monthly | 3.95 |
| 3 Month | 11.75 |
| 6 Month | 32.38 |
| Yearly | -27.08 |
| 5 Year | -13.12 |
| All Time | -13.12 |
Misc.
| Average Day Range (14) | 14.37 |
|---|---|
| Average Directional Index (14) | 26.47 |
| Average True Range (14) | 13.62 |
| Williams Percent Range (14) | -52.00 |
| Rate Of Change (9) | -1.63 |
| Hull Moving Average (9) | 430.00 |
| Momentum (10) | -13.15 |
| Parabolic SAR | 446.78 |
PIVOT POINTS of Delhivery Limited (DELHIVERY)
| Name | S3 | S2 | S1 | Pivot Points | R1 | R2 | R3 |
|---|---|---|---|---|---|---|---|
| Classic | 325.02 | 375.37 | 406.43 | 425.72 | 456.78 | 476.07 | 526.42 |
| Fibonacci | 375.37 | 394.60 | 406.48 | 425.72 | 444.95 | 456.83 | 476.07 |
| Camarilla | 423.65 | 428.27 | 432.88 | 425.72 | 442.12 | 446.73 | 451.35 |
| Woodie's | 359.62 | 377.14 | 409.97 | 427.49 | 460.32 | 477.84 | 510.68 |
| DeMark's | - | - | 416.07 | 430.54 | 466.43 | - | - |
Financial Analysis of Delhivery Limited (DELHIVERY)
Income Statement
| Basic EPS (FY) | -14.09 |
|---|---|
| Basic EPS (TTM) | -9.55 |
| EBITDA (Annual YoY Growth) | -173.19 |
| EBITDA (Quarterly QoQ Growth) | -197.07 |
| EBITDA (Quarterly YoY Growth) | 94.88 |
| EBITDA (TTM) | -2,105,650,000.00 |
| EPS Diluted (Annual YoY Growth) | 17.03 |
| EPS Diluted (FY) | -14.09 |
| EPS Diluted (MRQ) | -1.23 |
| EPS Diluted (Quarterly QoQ Growth) | 42.82 |
| EPS Diluted (Quarterly YoY Growth) | 79.15 |
| EPS Diluted (TTM) | -9.55 |
| EPS Forecast (MRQ) | -1.66 |
| Free Cash Flow (Annual YoY Growth) | 18.61 |
| Free Cash Flow Margin (FY) | -7.62 |
| Gross Profit (Annual YoY Growth) | -1,021.44 |
| Gross Profit (FY) | -6,769,330,000.00 |
| Gross Profit (MRQ) | -288,180,000.00 |
| Gross Profit (Quarterly QoQ Growth) | 74.22 |
| Gross Profit (Quarterly YoY Growth) | 87.91 |
| Last Year Revenue (FY) | 72.3 B |
| Revenue (Annual YoY Growth) | 4.98 |
| Revenue (Quarterly QoQ Growth) | 3.77 |
| Revenue (Quarterly YoY Growth) | 10.54 |
| Net Income (Annual YoY Growth) | 0.32 |
| Net Income (FY) | -10,077,790,000.00 |
| Net Income (Quarterly QoQ Growth) | 43.61 |
| Net Income (Quarterly YoY Growth) | 77.59 |
| Total Revenue (FY) | 72.3 B |
Valuation
| Shares Float | 339 M |
|---|---|
| Price to Revenue Ratio (TTM) | 4.25 |
| Total Shares Outstanding | 731.2 M |
| Selling & Admin expenses Ratio (FY) | 8.38 |
| Selling & Admin expenses Ratio (TTM) | 7.56 |
Balance Sheet
| Total Assets (Annual YoY Growth) | 35.61 |
|---|---|
| Total Debt (Annual YoY Growth) | -16.17 |
| Total Liabilities (FY) | 20.1 B |
| Cash & Equivalents (FY) | 6.5 B |
| Cash and short term investments (FY) | 21.3 B |
Operating Metrics
Dividends
Margins
| Net Margin (FY) | -13.95 |
|---|---|
| Net Margin (TTM) | -9.42 |
| Gross Margin (FY) | -9.37 |
| Gross Margin (TTM) | -6.31 |
| Operating Margin (FY) | -17.75 |
| Operating Margin (TTM) | -13.87 |
| Pretax Margin (TTM) | -10.18 |
Related Companies (Peers) to Delhivery Limited (DELHIVERY)
| Price | 8.85 0.05 (0.57%) | 52 Week High | 27.50 |
|---|---|---|---|
| ISIN | INE648Z01023 | 52 Week Low | 8.15 |
| Industry | Air Freight/Couriers | Volume | 91,641 |
| Sector | Transportation | P/E Ratio TTM | |
| Market Cap | 1.3 B | 1 Year Beta |

| Price | 258.90 -2.25 (-0.86%) | 52 Week High | 294.85 |
|---|---|---|---|
| ISIN | INE991I01015 | 52 Week Low | 183.60 |
| Industry | Air Freight/Couriers | Volume | 3,290 |
| Sector | Transportation | P/E Ratio TTM | 23.76 |
| Market Cap | 2 B | 1 Year Beta | 0.89 |
| Price | 301.35 6.35 (2.15%) | 52 Week High | 305.00 |
|---|---|---|---|
| ISIN | INE680Z01018 | 52 Week Low | 99.95 |
| Industry | Air Freight/Couriers | Volume | 201.7 T |
| Sector | Transportation | P/E Ratio TTM | |
| Market Cap | 3.5 B | 1 Year Beta | -0.24 |

| Price | 6,790.05 74.50 (1.11%) | 52 Week High | 9,640.00 |
|---|---|---|---|
| ISIN | INE233B01017 | 52 Week Low | 5,631.75 |
| Industry | Air Freight/Couriers | Volume | 14,342 |
| Sector | Transportation | P/E Ratio TTM | 51.47 |
| Market Cap | 159.7 B | 1 Year Beta | 0.11 |
| Price | 6.05 -0.05 (-0.82%) | 52 Week High | 7.40 |
|---|---|---|---|
| ISIN | INE360L01017 | 52 Week Low | 3.80 |
| Industry | Air Freight/Couriers | Volume | 44,601 |
| Sector | Transportation | P/E Ratio TTM | |
| Market Cap | 352.2 M | 1 Year Beta | 1.46 |
| Price | 68.65 -1.70 (-2.42%) | 52 Week High | 93.20 |
|---|---|---|---|
| ISIN | INE263W01010 | 52 Week Low | 49.65 |
| Industry | Air Freight/Couriers | Volume | 10,372 |
| Sector | Transportation | P/E Ratio TTM | 15.07 |
| Market Cap | 2.1 B | 1 Year Beta | -0.25 |
| Price | 387.65 -6.45 (-1.64%) | 52 Week High | 559.00 |
|---|---|---|---|
| ISIN | INE766P01016 | 52 Week Low | 349.70 |
| Industry | Air Freight/Couriers | Volume | 190.5 T |
| Sector | Transportation | P/E Ratio TTM | 656.59 |
| Market Cap | 28.4 B | 1 Year Beta | 0.50 |

| Price | 139.85 0.70 (0.50%) | 52 Week High | 164.00 |
|---|---|---|---|
| ISIN | INE109A01011 | 52 Week Low | 79.20 |
| Industry | Air Freight/Couriers | Volume | 2.5 M |
| Sector | Transportation | P/E Ratio TTM | 6.82 |
| Market Cap | 64.8 B | 1 Year Beta | -0.04 |
| Price | 163.00 6.85 (4.39%) | 52 Week High | 199.00 |
|---|---|---|---|
| ISIN | INE00CE01017 | 52 Week Low | 137.00 |
| Industry | Air Freight/Couriers | Volume | 113 |
| Sector | Transportation | P/E Ratio TTM | |
| Market Cap | 1.8 B | 1 Year Beta |
| Price | 27.90 0.00 (0.00%) | 52 Week High | 32.00 |
|---|---|---|---|
| ISIN | INE325D01025 | 52 Week Low | 21.50 |
| Industry | Air Freight/Couriers | Volume | 31,909 |
| Sector | Transportation | P/E Ratio TTM | 382.72 |
| Market Cap | 43.2 B | 1 Year Beta | -0.69 |
| Price | 1,466.60 -2.30 (-0.16%) | 52 Week High | 1,982.00 |
|---|---|---|---|
| ISIN | INE586V01016 | 52 Week Low | 1,374.00 |
| Industry | Air Freight/Couriers | Volume | 51,427 |
| Sector | Transportation | P/E Ratio TTM | 40.18 |
| Market Cap | 56.3 B | 1 Year Beta | -0.06 |
| Price | 148.70 0.35 (0.24%) | 52 Week High | 202.55 |
|---|---|---|---|
| ISIN | INE336X01012 | 52 Week Low | 116.00 |
| Industry | Air Freight/Couriers | Volume | 95,927 |
| Sector | Transportation | P/E Ratio TTM | 77.40 |
| Market Cap | 2.4 B | 1 Year Beta | 0.68 |
| Price | 99.90 0.75 (0.76%) | 52 Week High | 105.00 |
|---|---|---|---|
| ISIN | INE758T01015 | 52 Week Low | 44.35 |
| Industry | Air Freight/Couriers | Volume | 39.5 M |
| Sector | Transportation | P/E Ratio TTM | |
| Market Cap | 853.6 B | 1 Year Beta | 1.78 |
Delhivery Limited (DELHIVERY) Related Indices
The Nifty 200 Index is designed to reflect the behaviour and performance of large and mid market capitalization companies . Nifty 200 includes all companies forming part of Nifty 100 and Nifty Full Midcap 100 index. The Nifty 200 Index represents about 86% of the free float market capitalization of the stocks listed on NSE as on March 31, 2016. The total traded value for the last six months ending March 2016, of all index constituents is approximately 77% of the traded value of all stocks on NSE. more about Nifty 200
The Nifty Total Market Index will track the performance of 750 stocks covering large, mid, small and microcap segments via a single index.
All stocks that are part of Nifty 500 index and Nifty Microcap 250 index form part of the Nifty Total Market index. Stock’s weight is based on its free-float market capitalization. more about Nifty Total Market
The Nifty 500 represents the top 500 companies based on full market capitalisation and average daily turnover from the eligible universe. It represents about 94% of the free float market capitalization of the stocks listed on NSE as on March 31, 2016. The total traded value for the last six months ending March 2016, of all Index constituents is approximately 87% of the traded value of all stocks on NSE. more about Nifty 500
The Nifty500 Multicap 50:25:25 index aims to measure the performance of portfolio of large, mid and small market capitalisation companies with target weights assigned to each size segment. The Nifty500 Multicap 50:25:25 index includes all companies that are part of Nifty 500 index. While in Nifty 500 index, the total weight of each size segment (Large, Mid and Small cap) is based on the total free float market capitalisation of all stocks falling within that size segment, in Nifty500 Multicap 50:25:25 index, the total weight of each of these three segments (Large, Mid and Small cap) is fixed at 50%, 25% and 25% respectively at every quarterly rebalance date. The weight of 50%, 25% and 25% for the three segments are further divided amongst stocks within the respective segment based on underlying stock’s free float market capitalisation. Weight of each size segment may be different from its respective capped level between two rebalance dates due to price drift of underlying stocks. more about Nifty500 Multicap 50:25:25
Nifty Midcap 150 represents 150 companies (companies ranked 101-250) based on full market capitalisation from Nifty 500. The Nifty Midcap 150 Index represents about 11.4% of the free float market capitalization of the stocks listed on NSE as on March 31, 2016. The total traded value for the last six months ending March 2016, of all index constituents is approximately 19% of the traded value of all stocks on NSE. more about Nifty Midcap150
The Nifty Midcap 100 Index captures the movement of the midcap segment of the market. The Nifty Midcap 100 Index comprises 100 tradable stocks listed on the National Stock Exchange (NSE). The Nifty Midcap 100 Index represents about 11% of the free float market capitalization of the stocks listed on NSE as on March 31, 2018. The total traded value for the last six months ending March 2018, of all index constituents is approximately 20% of the traded value of all stocks on NSE. more about Nifty Midcap 100
The Nifty LargeMidcap 250 reflects the performance of a portfolio of 100 large cap and 150 mid cap companies listed on NSE, represented through the Nifty 100 and the Nifty Midcap 150 index respectively. The aggregate weight of large cap stocks and mid cap stocks is 50% each and are reset on a quarterly basis.
The index has a base date of April 01, 2005 and a base value of 1000. The Index is reconstituted on a semi-annual basis along with Nifty 100 and Nifty Midcap 150 index. more about Nifty LargeMidcap 250
The Nifty MidSmallcap 400 Index is designed to reflect the behaviour and performance of the mid and small market capitalisation companies.
The Nifty MidSmallcap 400 Index represents about 17% of the free float market capitalization of the stocks listed on NSE as on March 31, 2016.
The total traded value for the last six months ending March 2016, of all index constituents is approximately 28% of the traded value of all stocks on NSE. more about Nifty MidSmallcap 400
Stock Sectors
- 52Commercial Services
- 13Communications
- 72Consumer Durables
- 111Consumer Non-Durables
- 81Consumer Services
- 33Distribution Services
- 49Electronic Technology
- 18Energy Minerals
- 245Finance
- 20Health Services
- 95Health Technology
- 85Industrial Services
- 2Miscellaneous
- 134Non-Energy Minerals
- 357Process Industries
- 270Producer Manufacturing
- 31Retail Trade
- 103Technology Services
- 41Transportation
- 38Utilities
Stock Industries
- 3Advertising/Marketing Services
- 7Aerospace & Defense
- 62Agricultural Commodities/Milling
- 14Air Freight/Couriers
- 3Airlines
- 6Alternative Power Generation
- 4Aluminum
- 39Apparel/Footwear
- 9Apparel/Footwear Retail
- 64Auto Parts: OEM
- 11Automotive Aftermarket
- 9Beverages: Alcoholic
- 1Beverages: Non-Alcoholic
- 1Biotechnology
- 12Broadcasting
- 17Building Products
- 4Cable/Satellite TV
- 1Catalog/Specialty Distribution
- 40Chemicals: Agricultural
- 18Chemicals: Major Diversified
- 75Chemicals: Specialty
- 3Coal
- 4Commercial Printing/Forms
- 1Computer Communications
- 4Computer Peripherals
- 37Construction Materials
- 3Consumer Sundries
- 25Containers/Packaging
- 2Contract Drilling
- 5Data Processing Services
- 1Department Stores
- 1Drugstore Chains
- 25Electric Utilities
- 46Electrical Products
- 3Electronic Components
- 9Electronic Equipment/Instruments
- 11Electronic Production Equipment
- 4Electronics Distributors
- 1Electronics/Appliance Stores
- 9Electronics/Appliances
- 75Engineering & Construction
- 1Environmental Services
- 55Finance/Rental/Leasing
- 28Financial Conglomerates
- 3Financial Publishing/Services
- 3Food Distributors
- 3Food Retail
- 7Food: Major Diversified
- 7Food: Meat/Fish/Dairy
- 28Food: Specialty/Candy
- 9Forest Products
- 7Gas Distributors
- 10Home Furnishings
- 1Home Improvement Chains
- 7Homebuilding
- 13Hospital/Nursing Management
- 18Hotels/Resorts/Cruise lines
- 14Household/Personal Care
- 9Industrial Conglomerates
- 51Industrial Machinery
- 35Industrial Specialties
- 54Information Technology Services
- 3Integrated Oil
- 7Internet Retail
- 11Internet Software/Services
- 43Investment Banks/Brokers
- 16Investment Managers
- 1Investment Trusts/Mutual Funds
- 6Life/Health Insurance
- 18Major Banks
- 6Major Telecommunications
- 6Marine Shipping
- 1Medical Distributors
- 2Medical Specialties
- 7Medical/Nursing Services
- 32Metal Fabrication
- 1Miscellaneous
- 39Miscellaneous Commercial Services
- 24Miscellaneous Manufacturing
- 14Motor Vehicles
- 21Movies/Entertainment
- 4Multi-Line Insurance
- 3Office Equipment/Supplies
- 1Oil & Gas Pipelines
- 1Oil & Gas Production
- 11Oil Refining/Marketing
- 6Oilfield Services/Equipment
- 7Other Consumer Services
- 20Other Consumer Specialties
- 19Other Metals/Minerals
- 10Other Transportation
- 33Packaged Software
- 3Personnel Services
- 2Pharmaceuticals: Generic
- 84Pharmaceuticals: Major
- 6Pharmaceuticals: Other
- 1Precious Metals
- 4Publishing: Books/Magazines
- 7Publishing: Newspapers
- 18Pulp & Paper
- 1Railroads
- 51Real Estate Development
- 22Regional Banks
- 8Restaurants
- 3Semiconductors
- 2Specialty Insurance
- 7Specialty Stores
- 5Specialty Telecommunications
- 64Steel
- 11Telecommunications Equipment
- 84Textiles
- 3Tobacco
- 1Tools & Hardware
- 7Trucking
- 24Trucks/Construction/Farm Machinery
- 25Wholesale Distributors
- 2Wireless Telecommunications
Leave a Reply