Dolat Algotech Limited (DOLATALGO)
| Price | 47.40 0.25 (0.53%) | 52 Week High | 75.30 |
|---|---|---|---|
| ISIN | INE966A01022 | 52 Week Low | 39.25 |
| Industry | Investment Banks/Brokers | Volume | 108,808 |
| Sector | Finance | P/E Ratio TTM | 9.24 |
| Market Cap | 8.3 B | 1 Year Beta | 1.12 |

Dolat Algotech Limited (DOLATALGO) is an Indian company that was founded in 2003. It is headquartered in Ahmedabad, Gujarat, India. DOLATALGO is a leading provider of financial technology (fintech) solutions in India. The company’s products include trading platforms, risk management software, and back-office solutions. DOLATALGO is a well-managed and profitable organization. It has been consistently profitable and has been paying dividends to its shareholders since its inception. The company has a strong track record of innovation, and has introduced a number of new products in recent years.
DOLATALGO is a good investment option for those who are looking for a reliable and experienced fintech company in India. The company has a strong track record of success and is well-positioned for future growth. However, it is important to note that the fintech industry is still in its early stages of development, and DOLATALGO could be affected by changes in the market.
Some of the risks involved in investing in DOLATALGO include:
- The fintech industry is still in its early stages of development, and DOLATALGO could be affected by changes in the market.
- The company’s products are subject to competition from other fintech companies, and DOLATALGO needs to continue to invest in research and development in order to maintain its competitive edge.
- The company’s products are subject to changes in government regulations, and DOLATALGO needs to keep up with the latest regulations in order to continue to sell its products.
It is important to weigh these risks carefully before deciding whether or not to invest in DOLATALGO.
Overall, DOLATALGO is a well-managed and profitable company with a strong track record of success. However, investors should be aware of the risks involved in the fintech industry before investing in the company.
Here are some additional details about Dolat Algotech Limited:
- Products: Trading platforms, risk management software, and back-office solutions.
- Headquarters: Ahmedabad, Gujarat, India
- Founded: 2003
- Employees: 500+
- Revenue: ₹500 crores (2021-22)
- Market capitalization: ₹250 crores (2022-23)
Dolat Algotech Limited (DOLATALGO) Chart
Technical Analysis of Dolat Algotech Limited (DOLATALGO)
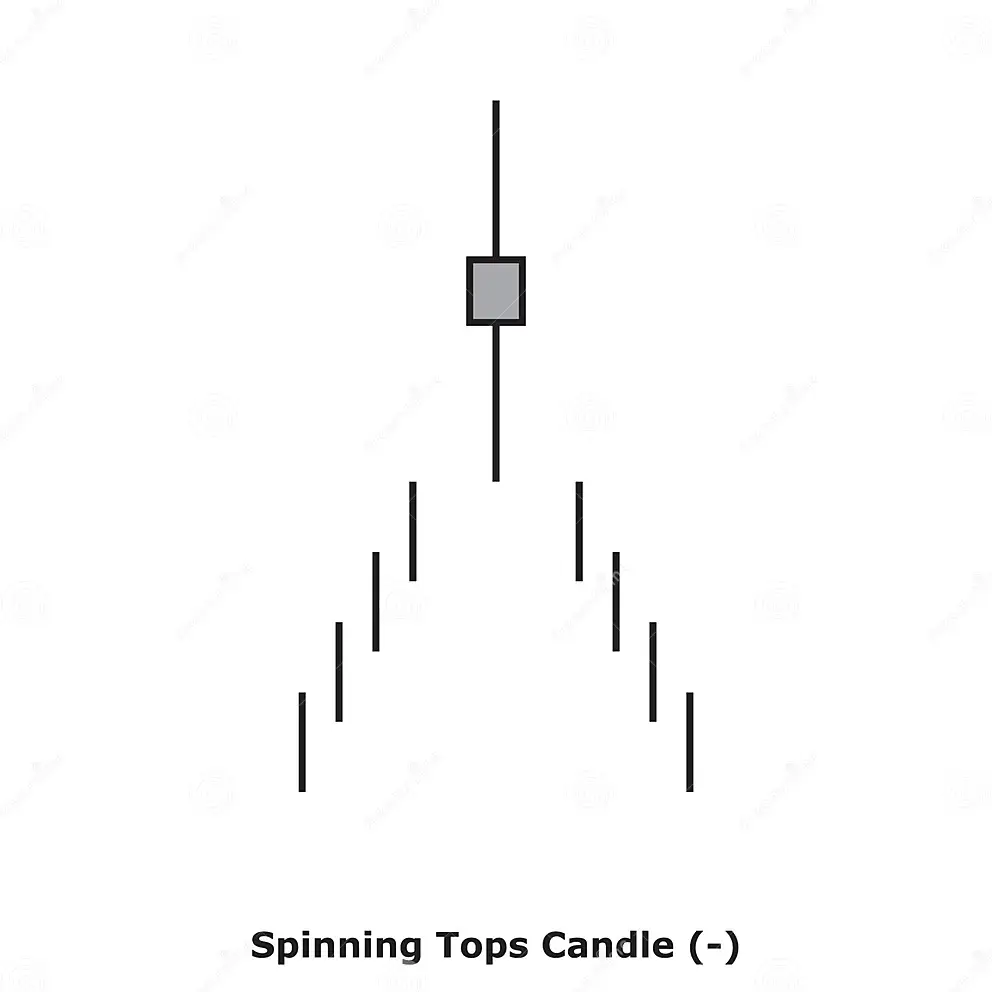
Spinning Top White
Spinning Top White is formed on Dolat Algotech Limited (DOLATALGO) in 1 Day Timeframe. White spinning tops are candlestick lines that are small, green-bodied, and possess shadows (upper and lower) that end up exceeding the length of candle bodies. They often signal indecision between buyer and seller.Moving Averages
| Period | Simple | Exponential |
|---|---|---|
| MA 5 | 47.80 | 47.82 |
| MA 10 | 48.73 | 48.30 |
| MA 20 | 48.77 | 48.19 |
| MA 30 | 47.43 | 47.80 |
| MA 50 | 46.53 | 47.30 |
| MA 100 | 46.55 | 47.79 |
| MA 200 | 50.98 | 51.77 |
Moving Average Rating
Technical Indicators
| Name | Value | Name | Value |
|---|---|---|---|
| Aroon Up (14) | 21.43 | Aroon Down (14) | 57.14 |
| MACD Level (12, 26) | 0.40 | MACD Signal (12, 26) | 0.82 |
| Relative Strength Index (7) | 40.99 | Relative Strength Index (14) | 47.90 |
| Stochastic %D (14 3 3) | 21.24 | Stochastic %K (14 3 3) | 12.54 |
| Stochastic RSI Fast (3, 3, 14, 14) | 3.35 | Stochastic RSI Slow (3, 3, 14, 14) | 4.52 |
| Bollinger Upper Band (20) | 53.48 | Bollinger Lower Band (20) | 44.05 |
| Keltner Channels Upper Band (20) | 52.08 | Keltner Channels Lower Band (20) | 44.30 |
| Donchian Channels Upper Band (20) | 53.80 | Donchian Channels Lower Band (20) | 43.80 |
| Ichimoku Conversion Line (9, 26, 52, 26) | 49.25 | Ichimoku Base Line (9, 26, 52, 26) | 48.60 |
| Ichimoku Leading Span A (9, 26, 52, 26) | 46.34 | Ichimoku Leading Span B (9, 26, 52, 26) | 46.40 |
| Positive Directional Indicator (14) | 16.49 | Negative Directional Indicator (14) | 21.20 |
| Volume Weighted Average Price | 47.30 | Volume Weighted Moving Average 20 | 50.57 |
Oscillator Rating

Oscillators
| Awesome Oscillator | 0.52 |
|---|---|
| Ultimate Oscillator (7,14,28) | 45.06 |
| Money Flow (14) | 49.60 |
| Chaikin Money Flow (20) | 0.06 |
| Commodity Channel Index (20) | -55.71 |
| Bull Bear Power | -2.22 |
High / Low
| 1 Month | 53.80 | 43.80 |
|---|---|---|
| 3 Month | 53.80 | 43.20 |
| 6 Month | 54.85 | 39.25 |
| 52 Week | 75.30 | 39.25 |
| All Time | 127.90 | 27.30 |
Volume
| Volume | 108,808.00 |
|---|---|
| Average 10 D | 169.1 T |
| Average 30 D | 332.7 T |
| Average 60 D | 228.3 T |
| Average 90 D | 196.2 T |
Change/Volatility
| Change | 0.25 (0.53%) |
|---|---|
| Change 1W | -1.50 (-3.07%) |
| Change 1M | -2.65 (-5.29%) |
| Volatility | 2.79 |
| Volatility W | 2.61 |
Performance
| Yesterday | -25.94 |
|---|---|
| Weekly | -5.11 |
| Monthly | 7.12 |
| 3 Month | -0.11 |
| 6 Month | 2.93 |
| Yearly | -33.33 |
| 5 Year | 12.72 |
| All Time | 12.72 |
Misc.
| Average Day Range (14) | 2.03 |
|---|---|
| Average Directional Index (14) | 24.20 |
| Average True Range (14) | 1.99 |
| Williams Percent Range (14) | -88.41 |
| Rate Of Change (9) | -6.78 |
| Hull Moving Average (9) | 47.03 |
| Momentum (10) | -3.75 |
| Parabolic SAR | 52.98 |
PIVOT POINTS of Dolat Algotech Limited (DOLATALGO)
| Name | S3 | S2 | S1 | Pivot Points | R1 | R2 | R3 |
|---|---|---|---|---|---|---|---|
| Classic | 28.28 | 38.68 | 44.37 | 49.08 | 54.77 | 59.48 | 69.88 |
| Fibonacci | 38.68 | 42.66 | 45.11 | 49.08 | 53.06 | 55.51 | 59.48 |
| Camarilla | 47.19 | 48.14 | 49.10 | 49.08 | 51.00 | 51.96 | 52.91 |
| Woodie's | 34.40 | 38.90 | 44.80 | 49.30 | 55.20 | 59.70 | 65.60 |
| DeMark's | - | - | 46.73 | 50.26 | 57.12 | - | - |
Financial Analysis of Dolat Algotech Limited (DOLATALGO)
Income Statement
| Basic EPS (FY) | 6.59 |
|---|---|
| Basic EPS (TTM) | 5.13 |
| EBITDA (Annual YoY Growth) | -23.57 |
| EBITDA (Quarterly QoQ Growth) | 85.88 |
| EBITDA (Quarterly YoY Growth) | -64.42 |
| EBITDA (TTM) | 1.3 B |
| EBITDA (TTM YoY Growth) | -42.48 |
| EPS Diluted (Annual YoY Growth) | -30.72 |
| EPS Diluted (FY) | 6.59 |
| EPS Diluted (Quarterly QoQ Growth) | 117.14 |
| EPS Diluted (Quarterly YoY Growth) | -66.61 |
| EPS Diluted (TTM) | 5.13 |
| EPS Diluted (TTM YoY Growth) | -43.76 |
| Free Cash Flow (Annual YoY Growth) | -31.76 |
| Free Cash Flow Margin (FY) | 41.39 |
| Gross Profit (Annual YoY Growth) | -12.12 |
| Gross Profit (FY) | 2.4 B |
| Gross Profit (MRQ) | 371.9 M |
| Gross Profit (Quarterly QoQ Growth) | 26.16 |
| Gross Profit (Quarterly YoY Growth) | -46.18 |
| Gross Profit (TTM YoY Growth) | -28.23 |
| Last Year Revenue (FY) | 2.8 B |
| Revenue (Annual YoY Growth) | -13.39 |
| Revenue per Employee (FY) | 73.4 M |
| Revenue (Quarterly QoQ Growth) | 17.54 |
| Revenue (Quarterly YoY Growth) | -41.85 |
| Revenue (TTM YoY Growth) | -24.78 |
| Net Income (Annual YoY Growth) | -30.72 |
| Net Income (FY) | 1.2 B |
| Net Income (Quarterly QoQ Growth) | 117.14 |
| Net Income (Quarterly YoY Growth) | -66.61 |
| Net Income (TTM YoY Growth) | -43.72 |
| Total Revenue (FY) | 2.8 B |
Valuation
| Enterprise Value/EBITDA (TTM) | 6.43 |
|---|---|
| Number of Employees | 38.00 |
| Number of Shareholders | 41,833.00 |
| Shares Float | 117.9 M |
| Price to Book (FY) | 1.31 |
| Price to Earnings Ratio (TTM) | 9.24 |
| Price to Revenue Ratio (TTM) | 3.40 |
| Price to Sales (FY) | 2.99 |
| Total Shares Outstanding | 176 M |
Balance Sheet
| Total Assets (Annual YoY Growth) | 5.13 |
|---|---|
| Total Debt (Annual YoY Growth) | -19.80 |
| Total Liabilities (FY) | 1.6 B |
| Cash & Equivalents (FY) | 11.2 M |
| Cash and short term investments (FY) | 2.8 B |
Operating Metrics
Dividends
| Dividends Paid (FY) | -44,000,000.00 |
|---|---|
| Dividends per share (Annual YoY Growth) | -100.00 |
Margins
| Net Margin (FY) | 41.58 |
|---|---|
| Net Margin (TTM) | 36.86 |
| Gross Margin (FY) | 87.60 |
| Gross Margin (TTM) | 82.00 |
| Operating Margin (FY) | 63.61 |
| Operating Margin (TTM) | 52.35 |
| Pretax Margin (TTM) | 52.35 |
Related Companies (Peers) to Dolat Algotech Limited (DOLATALGO)
| Price | 19.00 -0.35 (-1.81%) | 52 Week High | 25.30 |
|---|---|---|---|
| ISIN | INE253B01015 | 52 Week Low | 16.50 |
| Industry | Investment Banks/Brokers | Volume | 6,600 |
| Sector | Finance | P/E Ratio TTM | |
| Market Cap | 201.6 M | 1 Year Beta | 0.43 |

| Price | 426.75 1.80 (0.42%) | 52 Week High | 485.00 |
|---|---|---|---|
| ISIN | INE618L01018 | 52 Week Low | 270.10 |
| Industry | Investment Banks/Brokers | Volume | 26,952 |
| Sector | Finance | P/E Ratio TTM | 26.09 |
| Market Cap | 13.1 B | 1 Year Beta | 0.65 |
| Price | 69.95 1.05 (1.52%) | 52 Week High | 76.30 |
|---|---|---|---|
| ISIN | INE865C01022 | 52 Week Low | 42.65 |
| Industry | Investment Banks/Brokers | Volume | 141,764 |
| Sector | Finance | P/E Ratio TTM | 11.21 |
| Market Cap | 3.9 B | 1 Year Beta | 0.87 |

| Price | 88.80 -0.05 (-0.06%) | 52 Week High | 102.40 |
|---|---|---|---|
| ISIN | INE326B01027 | 52 Week Low | 59.00 |
| Industry | Investment Banks/Brokers | Volume | 21,368 |
| Sector | Finance | P/E Ratio TTM | 15.42 |
| Market Cap | 2.4 B | 1 Year Beta | 0.65 |
| Price | 1,842.40 -23.30 (-1.25%) | 52 Week High | 1,937.25 |
|---|---|---|---|
| ISIN | INE732I01013 | 52 Week Low | 999.00 |
| Industry | Investment Banks/Brokers | Volume | 265.8 T |
| Sector | Finance | P/E Ratio TTM | 16.86 |
| Market Cap | 156.5 B | 1 Year Beta | 1.80 |
| Price | 70.00 2.10 (3.09%) | 52 Week High | 78.50 |
|---|---|---|---|
| ISIN | INE420B01036 | 52 Week Low | 33.25 |
| Industry | Investment Banks/Brokers | Volume | 725.1 T |
| Sector | Finance | P/E Ratio TTM | 21.92 |
| Market Cap | 7 B | 1 Year Beta | 1.27 |

| Price | 74.05 -0.65 (-0.87%) | 52 Week High | 90.50 |
|---|---|---|---|
| ISIN | INE218C01016 | 52 Week Low | 53.85 |
| Industry | Investment Banks/Brokers | Volume | 10,474 |
| Sector | Finance | P/E Ratio TTM | 23.49 |
| Market Cap | 1 B | 1 Year Beta | 0.33 |
| Price | 22.90 0.15 (0.66%) | 52 Week High | 38.00 |
|---|---|---|---|
| ISIN | INE791A01024 | 52 Week Low | 17.60 |
| Industry | Investment Banks/Brokers | Volume | 57,714 |
| Sector | Finance | P/E Ratio TTM | 16.96 |
| Market Cap | 1.2 B | 1 Year Beta | -1.02 |
| Price | 1,196.35 20.70 (1.76%) | 52 Week High | 1,438.00 |
|---|---|---|---|
| ISIN | INE118H01025 | 52 Week Low | 406.20 |
| Industry | Investment Banks/Brokers | Volume | 1.1 M |
| Sector | Finance | P/E Ratio TTM | 26.17 |
| Market Cap | 159.3 B | 1 Year Beta | 1.63 |
| Price | 1,312.90 21.05 (1.63%) | 52 Week High | 1,430.00 |
|---|---|---|---|
| ISIN | INE736A01011 | 52 Week Low | 880.90 |
| Industry | Investment Banks/Brokers | Volume | 838.4 T |
| Sector | Finance | P/E Ratio TTM | 47.03 |
| Market Cap | 135 B | 1 Year Beta | 1.31 |
| Price | 349.75 13.05 (3.88%) | 52 Week High | 366.95 |
|---|---|---|---|
| ISIN | INE718F01018 | 52 Week Low | 189.10 |
| Industry | Investment Banks/Brokers | Volume | 153.2 T |
| Sector | Finance | P/E Ratio TTM | 15.25 |
| Market Cap | 7.5 B | 1 Year Beta | 0.87 |
| Price | 27.55 -0.40 (-1.43%) | 52 Week High | 39.25 |
|---|---|---|---|
| ISIN | INE921B01025 | 52 Week Low | 20.70 |
| Industry | Investment Banks/Brokers | Volume | 21,450 |
| Sector | Finance | P/E Ratio TTM | 15.39 |
| Market Cap | 987 M | 1 Year Beta | 0.68 |
| Price | 53.45 -0.10 (-0.19%) | 52 Week High | 59.50 |
|---|---|---|---|
| ISIN | INE532F01054 | 52 Week Low | 29.58 |
| Industry | Investment Banks/Brokers | Volume | 2.8 M |
| Sector | Finance | P/E Ratio TTM | 13.04 |
| Market Cap | 50.5 B | 1 Year Beta | 1.42 |
| Price | 51.40 0.20 (0.39%) | 52 Week High | 59.40 |
|---|---|---|---|
| ISIN | INE007B01023 | 52 Week Low | 39.15 |
| Industry | Investment Banks/Brokers | Volume | 314.7 T |
| Sector | Finance | P/E Ratio TTM | 12.71 |
| Market Cap | 12.3 B | 1 Year Beta | 0.61 |
| Price | 56.15 -0.10 (-0.18%) | 52 Week High | 63.10 |
|---|---|---|---|
| ISIN | INE550B01022 | 52 Week Low | 43.60 |
| Industry | Investment Banks/Brokers | Volume | 12,667 |
| Sector | Finance | P/E Ratio TTM | 2.98 |
| Market Cap | 406.8 M | 1 Year Beta | 1.73 |
| Price | 613.45 -3.95 (-0.64%) | 52 Week High | 652.00 |
|---|---|---|---|
| ISIN | INE763G01038 | 52 Week Low | 416.30 |
| Industry | Investment Banks/Brokers | Volume | 565.3 T |
| Sector | Finance | P/E Ratio TTM | 17.81 |
| Market Cap | 199.3 B | 1 Year Beta | 1.05 |
| Price | 77.35 0.85 (1.11%) | 52 Week High | 82.55 |
|---|---|---|---|
| ISIN | INE489L01022 | 52 Week Low | 48.20 |
| Industry | Investment Banks/Brokers | Volume | 324.8 T |
| Sector | Finance | P/E Ratio TTM | 8.44 |
| Market Cap | 23.4 B | 1 Year Beta | 1.06 |
| Price | 8.00 0.20 (2.56%) | 52 Week High | 9.50 |
|---|---|---|---|
| ISIN | INE050B01023 | 52 Week Low | 5.65 |
| Industry | Investment Banks/Brokers | Volume | 205.4 T |
| Sector | Finance | P/E Ratio TTM | 19.47 |
| Market Cap | 2.5 B | 1 Year Beta | 1.22 |
| Price | 38.05 -0.40 (-1.04%) | 52 Week High | 47.05 |
|---|---|---|---|
| ISIN | INE841B01017 | 52 Week Low | 20.15 |
| Industry | Investment Banks/Brokers | Volume | 284.3 T |
| Sector | Finance | P/E Ratio TTM | 29.59 |
| Market Cap | 1.7 B | 1 Year Beta | 1.56 |
| Price | 130.75 -0.85 (-0.65%) | 52 Week High | 163.75 |
|---|---|---|---|
| ISIN | INE022Q01020 | 52 Week Low | 116.00 |
| Industry | Investment Banks/Brokers | Volume | 4.1 M |
| Sector | Finance | P/E Ratio TTM | 37.39 |
| Market Cap | 117.3 B | 1 Year Beta | 0.78 |
| Price | 226.50 -1.50 (-0.66%) | 52 Week High | 480.35 |
|---|---|---|---|
| ISIN | INE337M01013 | 52 Week Low | 148.50 |
| Industry | Investment Banks/Brokers | Volume | 47 |
| Sector | Finance | P/E Ratio TTM | 105.90 |
| Market Cap | 2.3 B | 1 Year Beta | 1.52 |
| Price | 2.30 -0.05 (-2.13%) | 52 Week High | 3.20 |
|---|---|---|---|
| ISIN | INE878H01024 | 52 Week Low | 1.45 |
| Industry | Investment Banks/Brokers | Volume | 4.2 M |
| Sector | Finance | P/E Ratio TTM | 24.76 |
| Market Cap | 1.9 B | 1 Year Beta | 1.78 |
| Price | 85.35 -0.30 (-0.35%) | 52 Week High | 95.90 |
|---|---|---|---|
| ISIN | INE780C01023 | 52 Week Low | 57.85 |
| Industry | Investment Banks/Brokers | Volume | 2.5 M |
| Sector | Finance | P/E Ratio TTM | 13.74 |
| Market Cap | 81.8 B | 1 Year Beta | 0.94 |
| Price | 4,735.10 100.20 (2.16%) | 52 Week High | 5,084.95 |
|---|---|---|---|
| ISIN | INE824G01012 | 52 Week Low | 3,681.00 |
| Industry | Investment Banks/Brokers | Volume | 1,565 |
| Sector | Finance | P/E Ratio TTM | 15.00 |
| Market Cap | 51.5 B | 1 Year Beta | 1.46 |
| Price | 113.60 2.95 (2.67%) | 52 Week High | 137.80 |
|---|---|---|---|
| ISIN | INE681C01015 | 52 Week Low | 77.70 |
| Industry | Investment Banks/Brokers | Volume | 37,649 |
| Sector | Finance | P/E Ratio TTM | 8.65 |
| Market Cap | 768.2 M | 1 Year Beta | 1.53 |
| Price | 25.25 0.20 (0.80%) | 52 Week High | 44.80 |
|---|---|---|---|
| ISIN | INE060B01014 | 52 Week Low | 21.15 |
| Industry | Investment Banks/Brokers | Volume | 21,654 |
| Sector | Finance | P/E Ratio TTM | 46.03 |
| Market Cap | 406.5 M | 1 Year Beta | 1.50 |
| Price | 330.50 -2.75 (-0.83%) | 52 Week High | 419.45 |
|---|---|---|---|
| ISIN | INE903D01011 | 52 Week Low | 190.00 |
| Industry | Investment Banks/Brokers | Volume | 239.2 T |
| Sector | Finance | P/E Ratio TTM | 22.79 |
| Market Cap | 11.3 B | 1 Year Beta | 2.44 |
| Price | 854.60 1.95 (0.23%) | 52 Week High | 962.80 |
|---|---|---|---|
| ISIN | INE338I01027 | 52 Week Low | 551.25 |
| Industry | Investment Banks/Brokers | Volume | 63,707 |
| Sector | Finance | P/E Ratio TTM | 8.88 |
| Market Cap | 126.3 B | 1 Year Beta | 1.05 |
| Price | 1,783.55 34.10 (1.95%) | 52 Week High | 1,875.65 |
|---|---|---|---|
| ISIN | INE745G01035 | 52 Week Low | 1,156.00 |
| Industry | Investment Banks/Brokers | Volume | 792.1 T |
| Sector | Finance | P/E Ratio TTM | 71.39 |
| Market Cap | 89.2 B | 1 Year Beta | 0.75 |
| Price | 15.90 -0.30 (-1.85%) | 52 Week High | 28.10 |
|---|---|---|---|
| ISIN | INE245I01016 | 52 Week Low | 10.70 |
| Industry | Investment Banks/Brokers | Volume | 2,235 |
| Sector | Finance | P/E Ratio TTM | |
| Market Cap | 220.8 M | 1 Year Beta | 0.52 |
| Price | 81.60 13.60 (20.00%) | 52 Week High | 81.60 |
|---|---|---|---|
| ISIN | INE859A01011 | 52 Week Low | 55.60 |
| Industry | Investment Banks/Brokers | Volume | 34.7 M |
| Sector | Finance | P/E Ratio TTM | 21.11 |
| Market Cap | 12.2 B | 1 Year Beta | 0.98 |
| Price | 148.60 -0.05 (-0.03%) | 52 Week High | 165.00 |
|---|---|---|---|
| ISIN | INE032B01021 | 52 Week Low | 85.60 |
| Industry | Investment Banks/Brokers | Volume | 25,205 |
| Sector | Finance | P/E Ratio TTM | 36.51 |
| Market Cap | 4.9 B | 1 Year Beta | 0.17 |
| Price | 1,361.75 15.50 (1.15%) | 52 Week High | 1,426.21 |
|---|---|---|---|
| ISIN | INE932X01018 | 52 Week Low | 990.60 |
| Industry | Investment Banks/Brokers | Volume | 64,861 |
| Sector | Finance | P/E Ratio TTM | 13.02 |
| Market Cap | 43.9 B | 1 Year Beta | 0.56 |
| Price | 78.30 -0.20 (-0.25%) | 52 Week High | 90.80 |
|---|---|---|---|
| ISIN | INE103C01036 | 52 Week Low | 68.60 |
| Industry | Investment Banks/Brokers | Volume | 37,022 |
| Sector | Finance | P/E Ratio TTM | |
| Market Cap | 8.2 B | 1 Year Beta | 0.34 |
| Price | 63.70 0.50 (0.79%) | 52 Week High | 75.00 |
|---|---|---|---|
| ISIN | INE395H01011 | 52 Week Low | 52.65 |
| Industry | Investment Banks/Brokers | Volume | 11,224 |
| Sector | Finance | P/E Ratio TTM | 8.65 |
| Market Cap | 954.8 M | 1 Year Beta | 0.55 |
| Price | 2,797.10 165.05 (6.27%) | 52 Week High | 2,855.95 |
|---|---|---|---|
| ISIN | INE672A01018 | 52 Week Low | 1,730.00 |
| Industry | Investment Banks/Brokers | Volume | 793.5 T |
| Sector | Finance | P/E Ratio TTM | 45.84 |
| Market Cap | 133.1 B | 1 Year Beta | 1.46 |
| Price | 78.35 -2.45 (-3.03%) | 52 Week High | 108.95 |
|---|---|---|---|
| ISIN | INE924D01017 | 52 Week Low | 63.35 |
| Industry | Investment Banks/Brokers | Volume | 26,735 |
| Sector | Finance | P/E Ratio TTM | 27.40 |
| Market Cap | 4.2 B | 1 Year Beta | 1.49 |
| Price | 10.10 0.05 (0.50%) | 52 Week High | 13.95 |
|---|---|---|---|
| ISIN | INE804H01012 | 52 Week Low | 7.80 |
| Industry | Investment Banks/Brokers | Volume | 37,489 |
| Sector | Finance | P/E Ratio TTM | |
| Market Cap | 488.4 M | 1 Year Beta | 0.99 |
| Price | 288.00 0.90 (0.31%) | 52 Week High | 319.15 |
|---|---|---|---|
| ISIN | INE583D01011 | 52 Week Low | 131.25 |
| Industry | Investment Banks/Brokers | Volume | 175.5 T |
| Sector | Finance | P/E Ratio TTM | 37.65 |
| Market Cap | 26.6 B | 1 Year Beta | 0.64 |
| Price | 195.40 -3.05 (-1.54%) | 52 Week High | 232.40 |
|---|---|---|---|
| ISIN | INE709A01018 | 52 Week Low | 120.50 |
| Industry | Investment Banks/Brokers | Volume | 54,586 |
| Sector | Finance | P/E Ratio TTM | 3.79 |
| Market Cap | 6.9 B | 1 Year Beta | 0.14 |
| Price | 487.00 7.00 (1.46%) | 52 Week High | 527.95 |
|---|---|---|---|
| ISIN | INE389K01018 | 52 Week Low | 241.10 |
| Industry | Investment Banks/Brokers | Volume | 28 |
| Sector | Finance | P/E Ratio TTM | 33.10 |
| Market Cap | 1.8 B | 1 Year Beta | 0.23 |
Stock Sectors
- 52Commercial Services
- 13Communications
- 72Consumer Durables
- 111Consumer Non-Durables
- 81Consumer Services
- 33Distribution Services
- 49Electronic Technology
- 18Energy Minerals
- 245Finance
- 20Health Services
- 95Health Technology
- 85Industrial Services
- 2Miscellaneous
- 134Non-Energy Minerals
- 357Process Industries
- 270Producer Manufacturing
- 31Retail Trade
- 103Technology Services
- 41Transportation
- 38Utilities
Stock Industries
- 3Advertising/Marketing Services
- 7Aerospace & Defense
- 62Agricultural Commodities/Milling
- 14Air Freight/Couriers
- 3Airlines
- 6Alternative Power Generation
- 4Aluminum
- 39Apparel/Footwear
- 9Apparel/Footwear Retail
- 64Auto Parts: OEM
- 11Automotive Aftermarket
- 9Beverages: Alcoholic
- 1Beverages: Non-Alcoholic
- 1Biotechnology
- 12Broadcasting
- 17Building Products
- 4Cable/Satellite TV
- 1Catalog/Specialty Distribution
- 40Chemicals: Agricultural
- 18Chemicals: Major Diversified
- 75Chemicals: Specialty
- 3Coal
- 4Commercial Printing/Forms
- 1Computer Communications
- 4Computer Peripherals
- 37Construction Materials
- 3Consumer Sundries
- 25Containers/Packaging
- 2Contract Drilling
- 5Data Processing Services
- 1Department Stores
- 1Drugstore Chains
- 25Electric Utilities
- 46Electrical Products
- 3Electronic Components
- 9Electronic Equipment/Instruments
- 11Electronic Production Equipment
- 4Electronics Distributors
- 1Electronics/Appliance Stores
- 9Electronics/Appliances
- 75Engineering & Construction
- 1Environmental Services
- 55Finance/Rental/Leasing
- 28Financial Conglomerates
- 3Financial Publishing/Services
- 3Food Distributors
- 3Food Retail
- 7Food: Major Diversified
- 7Food: Meat/Fish/Dairy
- 28Food: Specialty/Candy
- 9Forest Products
- 7Gas Distributors
- 10Home Furnishings
- 1Home Improvement Chains
- 7Homebuilding
- 13Hospital/Nursing Management
- 18Hotels/Resorts/Cruise lines
- 14Household/Personal Care
- 9Industrial Conglomerates
- 51Industrial Machinery
- 35Industrial Specialties
- 54Information Technology Services
- 3Integrated Oil
- 7Internet Retail
- 11Internet Software/Services
- 43Investment Banks/Brokers
- 16Investment Managers
- 1Investment Trusts/Mutual Funds
- 6Life/Health Insurance
- 18Major Banks
- 6Major Telecommunications
- 6Marine Shipping
- 1Medical Distributors
- 2Medical Specialties
- 7Medical/Nursing Services
- 32Metal Fabrication
- 1Miscellaneous
- 39Miscellaneous Commercial Services
- 24Miscellaneous Manufacturing
- 14Motor Vehicles
- 21Movies/Entertainment
- 4Multi-Line Insurance
- 3Office Equipment/Supplies
- 1Oil & Gas Pipelines
- 1Oil & Gas Production
- 11Oil Refining/Marketing
- 6Oilfield Services/Equipment
- 7Other Consumer Services
- 20Other Consumer Specialties
- 19Other Metals/Minerals
- 10Other Transportation
- 33Packaged Software
- 3Personnel Services
- 2Pharmaceuticals: Generic
- 84Pharmaceuticals: Major
- 6Pharmaceuticals: Other
- 1Precious Metals
- 4Publishing: Books/Magazines
- 7Publishing: Newspapers
- 18Pulp & Paper
- 1Railroads
- 51Real Estate Development
- 22Regional Banks
- 8Restaurants
- 3Semiconductors
- 2Specialty Insurance
- 7Specialty Stores
- 5Specialty Telecommunications
- 64Steel
- 11Telecommunications Equipment
- 84Textiles
- 3Tobacco
- 1Tools & Hardware
- 7Trucking
- 24Trucks/Construction/Farm Machinery
- 25Wholesale Distributors
- 2Wireless Telecommunications
Leave a Reply