Genus Power Infrastructures Limited (GENUSPOWER)
| Price | 270.05 3.85 (1.45%) | 52 Week High | 289.70 |
|---|---|---|---|
| ISIN | INE955D01029 | 52 Week Low | 76.00 |
| Industry | Electronic Equipment/Instruments | Volume | 774.7 T |
| Sector | Electronic Technology | P/E Ratio TTM | 159.52 |
| Market Cap | 68 B | 1 Year Beta | 1.76 |

- Genus Power Infrastructures Limited (GENUSPOWER) is an Indian company that was incorporated in 2008 and is headquartered in New Delhi, India.
- GENUSPOWER is a well-established company with a strong track record. The company is a leading provider of power transmission and distribution (T&D) infrastructure in India.
- GENUSPOWER’s products include high-voltage direct current (HVDC) systems, gas insulated switchgear (GIS), circuit breakers, and other T&D equipment. The company also provides services such as engineering, procurement, construction, and commissioning (EPC).
- GENUSPOWER has a strong presence in the Indian T&D market and has a market share of over 5%. The company is well-positioned to capitalize on the growing demand for T&D infrastructure in India.
Here are some of the key facts about Genus Power:
- Incorporated in 2008
- Headquartered in New Delhi, India
- Well-established company with a strong track record
- Leading provider of power transmission and distribution (T&D) infrastructure in India
- Products include high-voltage direct current (HVDC) systems, gas insulated switchgear (GIS), circuit breakers, and other T&D equipment
- Provides services such as engineering, procurement, construction, and commissioning (EPC)
- Strong presence in the Indian T&D market
- Market share of over 5%
Genus Power Infrastructures Limited (GENUSPOWER) Chart
Technical Analysis of Genus Power Infrastructures Limited (GENUSPOWER)
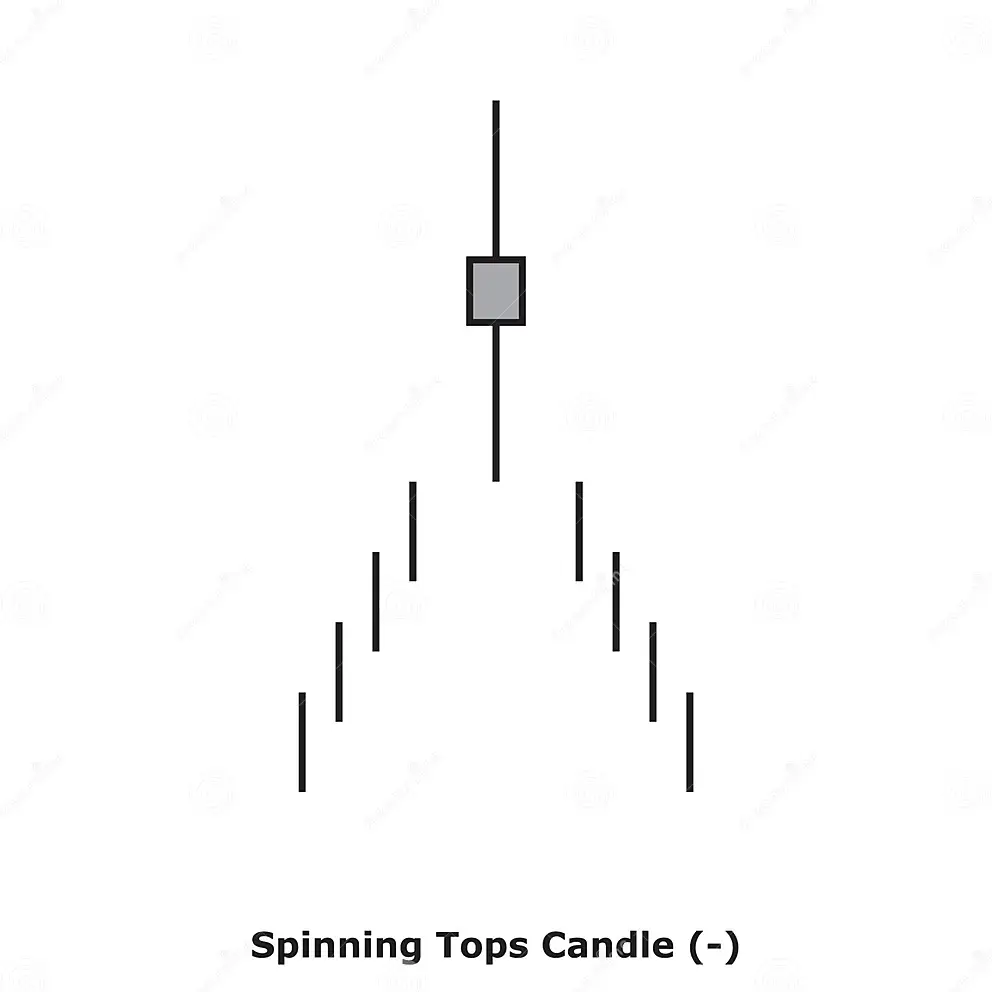
Spinning Top White
Spinning Top White is formed on Genus Power Infrastructures Limited (GENUSPOWER) in 1 Day Timeframe. White spinning tops are candlestick lines that are small, green-bodied, and possess shadows (upper and lower) that end up exceeding the length of candle bodies. They often signal indecision between buyer and seller.Moving Averages
| Period | Simple | Exponential |
|---|---|---|
| MA 5 | 264.68 | 265.66 |
| MA 10 | 266.17 | 264.84 |
| MA 20 | 264.85 | 257.49 |
| MA 30 | 249.36 | 246.59 |
| MA 50 | 222.40 | 224.63 |
| MA 100 | 164.85 | 185.28 |
| MA 200 | 126.49 | 147.20 |
Moving Average Rating
Technical Indicators
| Name | Value | Name | Value |
|---|---|---|---|
| Aroon Up (14) | 14.29 | Aroon Down (14) | 57.14 |
| MACD Level (12, 26) | 12.85 | MACD Signal (12, 26) | 16.30 |
| Relative Strength Index (7) | 56.76 | Relative Strength Index (14) | 59.38 |
| Stochastic %D (14 3 3) | 38.85 | Stochastic %K (14 3 3) | 41.56 |
| Stochastic RSI Fast (3, 3, 14, 14) | 14.67 | Stochastic RSI Slow (3, 3, 14, 14) | 8.80 |
| Bollinger Upper Band (20) | 284.98 | Bollinger Lower Band (20) | 244.71 |
| Keltner Channels Upper Band (20) | 287.09 | Keltner Channels Lower Band (20) | 227.89 |
| Donchian Channels Upper Band (20) | 289.70 | Donchian Channels Lower Band (20) | 233.70 |
| Ichimoku Conversion Line (9, 26, 52, 26) | 262.17 | Ichimoku Base Line (9, 26, 52, 26) | 249.98 |
| Ichimoku Leading Span A (9, 26, 52, 26) | 198.61 | Ichimoku Leading Span B (9, 26, 52, 26) | 163.02 |
| Positive Directional Indicator (14) | 25.67 | Negative Directional Indicator (14) | 16.76 |
| Volume Weighted Average Price | 268.87 | Volume Weighted Moving Average 20 | 265.93 |
Oscillator Rating

Oscillators
| Awesome Oscillator | 21.26 |
|---|---|
| Ultimate Oscillator (7,14,28) | 59.26 |
| Money Flow (14) | 42.63 |
| Chaikin Money Flow (20) | 0.11 |
| Commodity Channel Index (20) | 35.82 |
| Bull Bear Power | 9.81 |
High / Low
| 1 Month | 289.70 | 226.30 |
|---|---|---|
| 3 Month | 289.70 | 109.70 |
| 6 Month | 289.70 | 78.65 |
| 52 Week | 289.70 | 76.00 |
| All Time | 289.70 | 6.21 |
Volume
| Volume | 774.7 T |
|---|---|
| Average 10 D | 973.2 T |
| Average 30 D | 1.6 M |
| Average 60 D | 2.7 M |
| Average 90 D | 2.3 M |
Change/Volatility
| Change | 3.85 (1.45%) |
|---|---|
| Change 1W | -0.10 (-0.04%) |
| Change 1M | 11.45 (4.43%) |
| Volatility | 5.93 |
| Volatility W | 4.81 |
Performance
| Yesterday | 221.49 |
|---|---|
| Weekly | 1.54 |
| Monthly | 21.37 |
| 3 Month | 150.16 |
| 6 Month | 217.33 |
| Yearly | 233.60 |
| 5 Year | 680.49 |
| All Time | 211.12 |
Misc.
| Average Day Range (14) | 14.57 |
|---|---|
| Average Directional Index (14) | 37.87 |
| Average True Range (14) | 14.60 |
| Williams Percent Range (14) | -43.91 |
| Rate Of Change (9) | -1.87 |
| Hull Moving Average (9) | 262.47 |
| Momentum (10) | 4.85 |
| Parabolic SAR | 244.95 |
PIVOT POINTS of Genus Power Infrastructures Limited (GENUSPOWER)
| Name | S3 | S2 | S1 | Pivot Points | R1 | R2 | R3 |
|---|---|---|---|---|---|---|---|
| Classic | 25.95 | 130.90 | 194.75 | 235.85 | 299.70 | 340.80 | 445.75 |
| Fibonacci | 130.90 | 170.99 | 195.76 | 235.85 | 275.94 | 300.71 | 340.80 |
| Camarilla | 229.74 | 239.36 | 248.98 | 235.85 | 268.22 | 277.84 | 287.46 |
| Woodie's | 114.07 | 143.04 | 219.02 | 247.99 | 323.98 | 352.94 | 428.93 |
| DeMark's | - | - | 215.30 | 246.13 | 320.25 | - | - |
Financial Analysis of Genus Power Infrastructures Limited (GENUSPOWER)
Income Statement
| Basic EPS (FY) | 1.26 |
|---|---|
| Basic EPS (TTM) | 1.71 |
| EBITDA (Annual YoY Growth) | 36.87 |
| EBITDA (Quarterly QoQ Growth) | 5.25 |
| EBITDA (Quarterly YoY Growth) | 98.93 |
| EBITDA (TTM) | 928.1 M |
| EBITDA (TTM YoY Growth) | 34.75 |
| EPS Diluted (Annual YoY Growth) | -43.55 |
| EPS Diluted (FY) | 1.26 |
| EPS Diluted (Quarterly YoY Growth) | 94.12 |
| EPS Diluted (TTM) | 1.69 |
| EPS Diluted (TTM YoY Growth) | -13.68 |
| Free Cash Flow (Annual YoY Growth) | 15,948.26 |
| Free Cash Flow Margin (FY) | 6.69 |
| Gross Profit (Annual YoY Growth) | 24.39 |
| Gross Profit (FY) | 1.3 B |
| Gross Profit (MRQ) | 498.9 M |
| Gross Profit (Quarterly QoQ Growth) | 10.50 |
| Gross Profit (Quarterly YoY Growth) | 70.75 |
| Gross Profit (TTM YoY Growth) | 26.40 |
| Last Year Revenue (FY) | 8.1 B |
| Revenue (Annual YoY Growth) | 18.71 |
| Revenue per Employee (FY) | 6.4 M |
| Revenue (Quarterly QoQ Growth) | 29.06 |
| Revenue (Quarterly YoY Growth) | 39.60 |
| Revenue (TTM YoY Growth) | 18.97 |
| Net Income (Annual YoY Growth) | -49.57 |
| Net Income (FY) | 289.7 M |
| Net Income (Quarterly YoY Growth) | 93.08 |
| Net Income (TTM YoY Growth) | -12.05 |
| Total Revenue (FY) | 8.1 B |
Valuation
| Enterprise Value/EBITDA (TTM) | 73.27 |
|---|---|
| Number of Employees | 1,267.00 |
| Number of Shareholders | 54,290.00 |
| Shares Float | 86.7 M |
| Price to Book (FY) | 6.34 |
| Price to Earnings Ratio (TTM) | 159.52 |
| Price to Revenue Ratio (TTM) | 7.06 |
| Price to Sales (FY) | 7.71 |
| Total Shares Outstanding | 257.6 M |
| Research & development Ratio (FY) | 2.22 |
| Selling & Admin expenses Ratio (FY) | 3.79 |
| Selling & Admin expenses Ratio (TTM) | 10.59 |
Balance Sheet
| Total Assets (Annual YoY Growth) | 9.92 |
|---|---|
| Total Debt (Annual YoY Growth) | 28.23 |
| Total Liabilities (FY) | 6.8 B |
| Cash & Equivalents (FY) | 1.2 B |
| Cash and short term investments (FY) | 4.3 B |
Operating Metrics
Dividends
| Dividend Yield Forward | 0.28 |
|---|---|
| Dividends Paid (FY) | -57,687,000.00 |
| Dividends per share (Annual YoY Growth) | 200.00 |
| Dividends per Share (FY) | 0.75 |
Margins
| Net Margin (FY) | 3.59 |
|---|---|
| Net Margin (TTM) | 4.54 |
| Gross Margin (FY) | 15.75 |
| Gross Margin (TTM) | 18.98 |
| Operating Margin (FY) | 8.01 |
| Operating Margin (TTM) | 8.39 |
| Pretax Margin (TTM) | 6.94 |
Related Companies (Peers) to Genus Power Infrastructures Limited (GENUSPOWER)
| Price | 5,276.05 43.70 (0.84%) | 52 Week High | 5,739.95 |
|---|---|---|---|
| ISIN | INE372A01015 | 52 Week Low | 1,200.00 |
| Industry | Electronic Equipment/Instruments | Volume | 217.2 T |
| Sector | Electronic Technology | P/E Ratio TTM | 28.33 |
| Market Cap | 200.3 B | 1 Year Beta | 1.41 |

| Price | 1,595.85 -3.55 (-0.22%) | 52 Week High | 2,336.95 |
|---|---|---|---|
| ISIN | INE244A01016 | 52 Week Low | 586.10 |
| Industry | Electronic Equipment/Instruments | Volume | 2,397 |
| Sector | Electronic Technology | P/E Ratio TTM | 44.06 |
| Market Cap | 8.5 B | 1 Year Beta | 1.32 |

| Price | 4,199.80 19.95 (0.48%) | 52 Week High | 4,800.00 |
|---|---|---|---|
| ISIN | INE07Y701011 | 52 Week Low | 2,840.10 |
| Industry | Electronic Equipment/Instruments | Volume | 15,597 |
| Sector | Electronic Technology | P/E Ratio TTM | 187.42 |
| Market Cap | 177.4 B | 1 Year Beta | -0.48 |
| Price | 40,850.00 648.30 (1.61%) | 52 Week High | 44,150.00 |
|---|---|---|---|
| ISIN | INE671A01010 | 52 Week Low | 34,343.40 |
| Industry | Electronic Equipment/Instruments | Volume | 6,695 |
| Sector | Electronic Technology | P/E Ratio TTM | 82.18 |
| Market Cap | 354.6 B | 1 Year Beta | 0.74 |
| Price | 218.45 -4.05 (-1.82%) | 52 Week High | 269.40 |
|---|---|---|---|
| ISIN | INE495S01016 | 52 Week Low | 67.10 |
| Industry | Electronic Equipment/Instruments | Volume | 232.6 T |
| Sector | Electronic Technology | P/E Ratio TTM | 45.60 |
| Market Cap | 14.3 B | 1 Year Beta | 2.23 |
| Price | 105.80 0.10 (0.09%) | 52 Week High | 115.00 |
|---|---|---|---|
| ISIN | INE439T01012 | 52 Week Low | 66.25 |
| Industry | Electronic Equipment/Instruments | Volume | 3,106 |
| Sector | Electronic Technology | P/E Ratio TTM | 114.88 |
| Market Cap | 1.1 B | 1 Year Beta | -0.09 |
| Price | 353.80 -3.35 (-0.94%) | 52 Week High | 448.00 |
|---|---|---|---|
| ISIN | INE236G01019 | 52 Week Low | 240.05 |
| Industry | Electronic Equipment/Instruments | Volume | 22,919 |
| Sector | Electronic Technology | P/E Ratio TTM | 109.43 |
| Market Cap | 6.7 B | 1 Year Beta | 0.40 |

| Price | 273.95 -1.05 (-0.38%) | 52 Week High | 326.20 |
|---|---|---|---|
| ISIN | INE02WG01016 | 52 Week Low | 144.80 |
| Industry | Electronic Equipment/Instruments | Volume | 191 |
| Sector | Electronic Technology | P/E Ratio TTM | 66.38 |
| Market Cap | 3.7 B | 1 Year Beta | 1.10 |
Stock Sectors
- 52Commercial Services
- 13Communications
- 72Consumer Durables
- 111Consumer Non-Durables
- 81Consumer Services
- 33Distribution Services
- 49Electronic Technology
- 18Energy Minerals
- 245Finance
- 20Health Services
- 95Health Technology
- 85Industrial Services
- 2Miscellaneous
- 134Non-Energy Minerals
- 357Process Industries
- 270Producer Manufacturing
- 31Retail Trade
- 103Technology Services
- 41Transportation
- 38Utilities
Stock Industries
- 3Advertising/Marketing Services
- 7Aerospace & Defense
- 62Agricultural Commodities/Milling
- 14Air Freight/Couriers
- 3Airlines
- 6Alternative Power Generation
- 4Aluminum
- 39Apparel/Footwear
- 9Apparel/Footwear Retail
- 64Auto Parts: OEM
- 11Automotive Aftermarket
- 9Beverages: Alcoholic
- 1Beverages: Non-Alcoholic
- 1Biotechnology
- 12Broadcasting
- 17Building Products
- 4Cable/Satellite TV
- 1Catalog/Specialty Distribution
- 40Chemicals: Agricultural
- 18Chemicals: Major Diversified
- 75Chemicals: Specialty
- 3Coal
- 4Commercial Printing/Forms
- 1Computer Communications
- 4Computer Peripherals
- 37Construction Materials
- 3Consumer Sundries
- 25Containers/Packaging
- 2Contract Drilling
- 5Data Processing Services
- 1Department Stores
- 1Drugstore Chains
- 25Electric Utilities
- 46Electrical Products
- 3Electronic Components
- 9Electronic Equipment/Instruments
- 11Electronic Production Equipment
- 4Electronics Distributors
- 1Electronics/Appliance Stores
- 9Electronics/Appliances
- 75Engineering & Construction
- 1Environmental Services
- 55Finance/Rental/Leasing
- 28Financial Conglomerates
- 3Financial Publishing/Services
- 3Food Distributors
- 3Food Retail
- 7Food: Major Diversified
- 7Food: Meat/Fish/Dairy
- 28Food: Specialty/Candy
- 9Forest Products
- 7Gas Distributors
- 10Home Furnishings
- 1Home Improvement Chains
- 7Homebuilding
- 13Hospital/Nursing Management
- 18Hotels/Resorts/Cruise lines
- 14Household/Personal Care
- 9Industrial Conglomerates
- 51Industrial Machinery
- 35Industrial Specialties
- 54Information Technology Services
- 3Integrated Oil
- 7Internet Retail
- 11Internet Software/Services
- 43Investment Banks/Brokers
- 16Investment Managers
- 1Investment Trusts/Mutual Funds
- 6Life/Health Insurance
- 18Major Banks
- 6Major Telecommunications
- 6Marine Shipping
- 1Medical Distributors
- 2Medical Specialties
- 7Medical/Nursing Services
- 32Metal Fabrication
- 1Miscellaneous
- 39Miscellaneous Commercial Services
- 24Miscellaneous Manufacturing
- 14Motor Vehicles
- 21Movies/Entertainment
- 4Multi-Line Insurance
- 3Office Equipment/Supplies
- 1Oil & Gas Pipelines
- 1Oil & Gas Production
- 11Oil Refining/Marketing
- 6Oilfield Services/Equipment
- 7Other Consumer Services
- 20Other Consumer Specialties
- 19Other Metals/Minerals
- 10Other Transportation
- 33Packaged Software
- 3Personnel Services
- 2Pharmaceuticals: Generic
- 84Pharmaceuticals: Major
- 6Pharmaceuticals: Other
- 1Precious Metals
- 4Publishing: Books/Magazines
- 7Publishing: Newspapers
- 18Pulp & Paper
- 1Railroads
- 51Real Estate Development
- 22Regional Banks
- 8Restaurants
- 3Semiconductors
- 2Specialty Insurance
- 7Specialty Stores
- 5Specialty Telecommunications
- 64Steel
- 11Telecommunications Equipment
- 84Textiles
- 3Tobacco
- 1Tools & Hardware
- 7Trucking
- 24Trucks/Construction/Farm Machinery
- 25Wholesale Distributors
- 2Wireless Telecommunications
Leave a Reply