Rashtriya Chemicals and Fertilizers Limited (RCF)
| Price | 126.45 -0.35 (-0.28%) | 52 Week High | 144.85 |
|---|---|---|---|
| ISIN | INE027A01015 | 52 Week Low | 89.50 |
| Industry | Chemicals: Agricultural | Volume | 3.4 M |
| Sector | Process Industries | P/E Ratio TTM | 9.50 |
| Market Cap | 69.9 B | 1 Year Beta | 2.46 |

Rashtriya Chemicals and Fertilizers Limited (RCF) is a government-owned fertilizer and chemicals company headquartered in Mumbai, India. It is one of the largest fertilizer and chemicals companies in India, with a market capitalization of over ₹100 billion (US$1.3 billion).
RCF was founded in 1956 as a public sector undertaking by the Government of India. It is one of the eight national fertilizer companies in India. RCF has its headquarters in Mumbai, Maharashtra, and has manufacturing plants in Trombay, Nagpur, Puri, and Faridabad.
RCF produces a wide range of fertilizers, including urea, ammonia, and phosphates. It also produces a variety of chemicals, including methanol, nitric acid, and phosphoric acid. RCF has a network of over 1,000 dealerships across India and exports its products to over 50 countries.
RCF is a profitable company with a strong financial position. It has been ranked as one of the most valuable brands in India by Brand Finance. RCF is committed to sustainable development and has set ambitious targets to reduce its greenhouse gas emissions and to improve its water efficiency.
RCF is a well-managed company with a strong track record of success. It has been awarded the Deming Prize for Excellence, the highest award for quality in Japan. RCF is also a member of the World Economic Forum’s Global Lighthouse Network, which recognizes companies that are leaders in the adoption of advanced technologies.
RCF is well-positioned to continue to grow in the future, driven by the increasing demand for fertilizers and chemicals in India and around the world. The company is also expanding its product portfolio to include new areas, such as specialty fertilizers and chemicals.
Risks
RCF faces a number of risks, including:
- The volatility of the global fertilizer market
- The competition from other fertilizer and chemicals companies
- The regulatory environment in India
- The availability of raw materials
Despite these risks, RCF is well-managed and has a strong track record of success. It is well-positioned to overcome these challenges and to continue to grow in the future.
Here are some additional details about RCF’s business operations:
- RCF has a workforce of over 15,000 employees.
- The company’s annual revenue is over ₹50 billion (US$670 million).
- RCF has a research and development (R&D) budget of over ₹1 billion (US$13 million).
- The company has a number of international partnerships, including with BASF, Yara, and Mitsubishi Chemical.
RCF is a significant player in the Indian economy and is a major supplier of fertilizers and chemicals to the country. It is also a major exporter of its products to other countries. RCF is well-positioned to continue to grow in the future and to make a significant contribution to the Indian economy.
Rashtriya Chemicals and Fertilizers Limited (RCF) Chart
Technical Analysis of Rashtriya Chemicals and Fertilizers Limited (RCF)
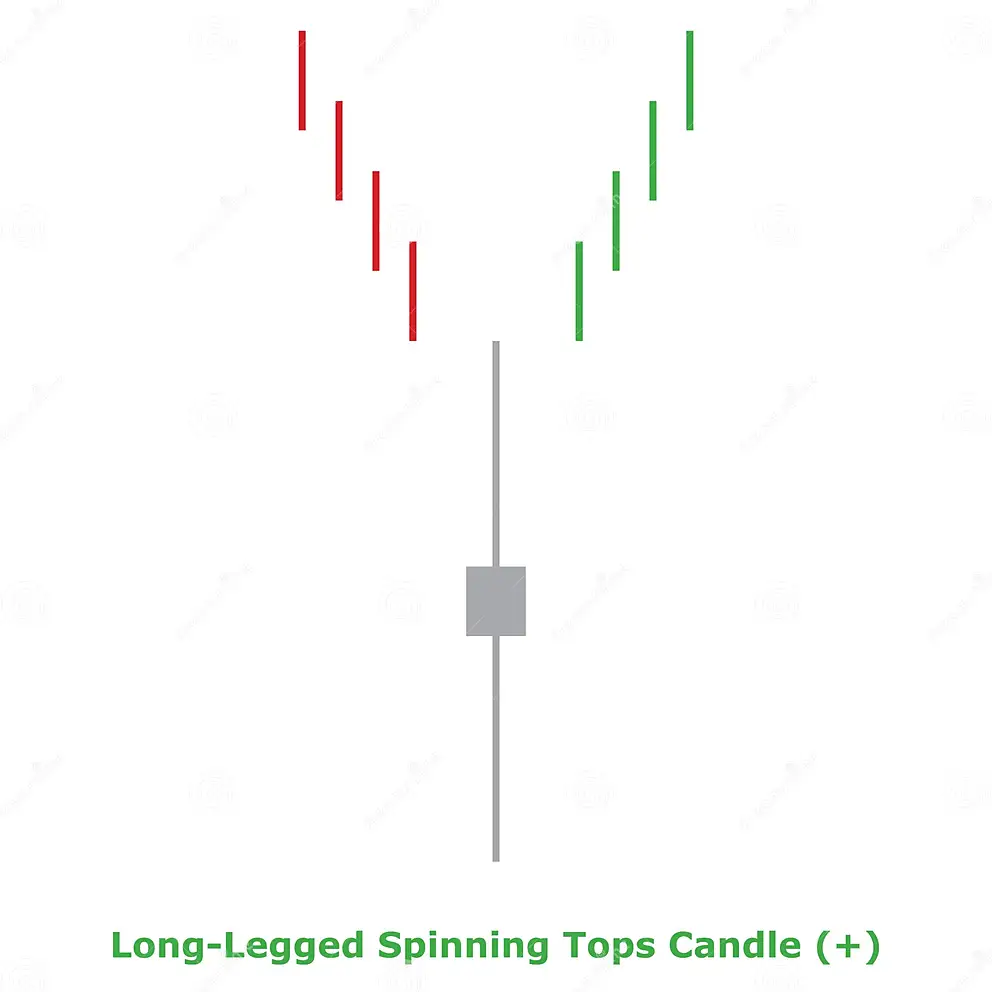
Spinning Top Black
Spinning Top Black is formed on Rashtriya Chemicals and Fertilizers Limited (RCF) in 1 Day Timeframe. Black spinning tops are candlestick lines that are small, red-bodied, and possess shadows (upper and lower) that end up exceeding the length of candle bodies. They often signal indecision.Moving Averages
| Period | Simple | Exponential |
|---|---|---|
| MA 5 | 129.10 | 127.91 |
| MA 10 | 128.19 | 127.65 |
| MA 20 | 126.36 | 125.51 |
| MA 30 | 121.70 | 123.41 |
| MA 50 | 118.62 | 120.25 |
| MA 100 | 113.46 | 115.86 |
| MA 200 | 113.35 | 111.26 |
Moving Average Rating
Technical Indicators
| Name | Value | Name | Value |
|---|---|---|---|
| Aroon Up (14) | 42.86 | Aroon Down (14) | 57.14 |
| MACD Level (12, 26) | 3.09 | MACD Signal (12, 26) | 3.45 |
| Relative Strength Index (7) | 48.00 | Relative Strength Index (14) | 53.53 |
| Stochastic %D (14 3 3) | 61.04 | Stochastic %K (14 3 3) | 48.74 |
| Stochastic RSI Fast (3, 3, 14, 14) | 12.00 | Stochastic RSI Slow (3, 3, 14, 14) | 26.36 |
| Bollinger Upper Band (20) | 133.33 | Bollinger Lower Band (20) | 119.40 |
| Keltner Channels Upper Band (20) | 136.01 | Keltner Channels Lower Band (20) | 115.01 |
| Donchian Channels Upper Band (20) | 135.00 | Donchian Channels Lower Band (20) | 118.00 |
| Ichimoku Conversion Line (9, 26, 52, 26) | 127.80 | Ichimoku Base Line (9, 26, 52, 26) | 121.50 |
| Ichimoku Leading Span A (9, 26, 52, 26) | 112.28 | Ichimoku Leading Span B (9, 26, 52, 26) | 111.45 |
| Positive Directional Indicator (14) | 25.94 | Negative Directional Indicator (14) | 17.66 |
| Volume Weighted Average Price | 126.60 | Volume Weighted Moving Average 20 | 127.54 |
Oscillator Rating

Oscillators
| Awesome Oscillator | 8.61 |
|---|---|
| Ultimate Oscillator (7,14,28) | 45.55 |
| Money Flow (14) | 74.11 |
| Chaikin Money Flow (20) | -0.02 |
| Commodity Channel Index (20) | -0.63 |
| Bull Bear Power | -0.84 |
High / Low
| 1 Month | 135.00 | 118.00 |
|---|---|---|
| 3 Month | 135.00 | 105.25 |
| 6 Month | 135.00 | 89.50 |
| 52 Week | 144.85 | 89.50 |
| All Time | 150.45 | 4.50 |
Volume
| Volume | 3.4 M |
|---|---|
| Average 10 D | 7.7 M |
| Average 30 D | 8.5 M |
| Average 60 D | 6.2 M |
| Average 90 D | 5.2 M |
Change/Volatility
| Change | -0.35 (-0.28%) |
|---|---|
| Change 1W | -3.95 (-3.03%) |
| Change 1M | 4.90 (4.03%) |
| Volatility | 2.44 |
| Volatility W | 2.98 |
Performance
| Yesterday | -6.33 |
|---|---|
| Weekly | -1.94 |
| Monthly | 12.65 |
| 3 Month | 14.85 |
| 6 Month | 28.44 |
| Yearly | 23.07 |
| 5 Year | 91.59 |
| All Time | 1,480.63 |
Misc.
| Average Day Range (14) | 5.70 |
|---|---|
| Average Directional Index (14) | 30.83 |
| Average True Range (14) | 5.16 |
| Williams Percent Range (14) | -59.38 |
| Rate Of Change (9) | 0.12 |
| Hull Moving Average (9) | 128.70 |
| Momentum (10) | -2.35 |
| Parabolic SAR | 121.43 |
PIVOT POINTS of Rashtriya Chemicals and Fertilizers Limited (RCF)
| Name | S3 | S2 | S1 | Pivot Points | R1 | R2 | R3 |
|---|---|---|---|---|---|---|---|
| Classic | 68.60 | 93.85 | 107.70 | 119.10 | 132.95 | 144.35 | 169.60 |
| Fibonacci | 93.85 | 103.50 | 109.45 | 119.10 | 128.75 | 134.70 | 144.35 |
| Camarilla | 114.61 | 116.92 | 119.24 | 119.10 | 123.86 | 126.18 | 128.49 |
| Woodie's | 84.33 | 94.79 | 109.58 | 120.04 | 134.83 | 145.29 | 160.08 |
| DeMark's | - | - | 113.40 | 121.95 | 138.65 | - | - |
Financial Analysis of Rashtriya Chemicals and Fertilizers Limited (RCF)
Income Statement
| Basic EPS (FY) | 17.52 |
|---|---|
| Basic EPS (TTM) | 13.31 |
| EBITDA (Quarterly QoQ Growth) | -34.25 |
| EBITDA (Quarterly YoY Growth) | -70.17 |
| EBITDA (TTM) | 11.7 B |
| EBITDA (TTM YoY Growth) | -1.37 |
| EPS Diluted (Annual YoY Growth) | 37.61 |
| EPS Diluted (FY) | 17.52 |
| EPS Diluted (Quarterly QoQ Growth) | -57.48 |
| EPS Diluted (Quarterly YoY Growth) | -77.37 |
| EPS Diluted (TTM) | 13.31 |
| EPS Diluted (TTM YoY Growth) | -4.99 |
| Free Cash Flow Margin (FY) | 0.89 |
| Gross Profit (FY) | 26.7 B |
| Gross Profit (MRQ) | 4.5 B |
| Gross Profit (Quarterly QoQ Growth) | -7.37 |
| Gross Profit (Quarterly YoY Growth) | -39.17 |
| Gross Profit (TTM YoY Growth) | 5.36 |
| Last Year Revenue (FY) | 214.5 B |
| Revenue (Annual YoY Growth) | 299.44 |
| Revenue (Quarterly QoQ Growth) | -13.68 |
| Revenue (Quarterly YoY Growth) | -18.43 |
| Revenue (TTM YoY Growth) | 33.55 |
| Net Income (Annual YoY Growth) | 37.57 |
| Net Income (FY) | 9.7 B |
| Net Income (Quarterly QoQ Growth) | -57.53 |
| Net Income (Quarterly YoY Growth) | -77.37 |
| Net Income (TTM YoY Growth) | -4.97 |
| Total Revenue (FY) | 214.5 B |
Valuation
| Enterprise Value/EBITDA (TTM) | 5.98 |
|---|---|
| Number of Shareholders | 230 T |
| Shares Float | 137.9 M |
| Price to Earnings Ratio (TTM) | 9.50 |
| Price to Revenue Ratio (TTM) | 0.34 |
| Total Shares Outstanding | 551.7 M |
| Selling & Admin expenses Ratio (FY) | 6.55 |
| Selling & Admin expenses Ratio (TTM) | 6.96 |
Balance Sheet
| Total Assets (Annual YoY Growth) | -8.91 |
|---|---|
| Total Debt (Annual YoY Growth) | -37.00 |
| Total Liabilities (FY) | 51.1 B |
| Cash & Equivalents (FY) | 645.3 M |
| Cash and short term investments (FY) | 645.3 M |
Operating Metrics
Dividends
| Dividend Yield Forward | 4.18 |
|---|---|
| Dividends Paid (FY) | -2,263,100,000.00 |
Margins
| Net Margin (FY) | 4.50 |
|---|---|
| Net Margin (TTM) | 3.58 |
| Gross Margin (FY) | 12.43 |
| Gross Margin (TTM) | 11.57 |
| Operating Margin (FY) | 5.88 |
| Operating Margin (TTM) | 4.61 |
| Pretax Margin (TTM) | 4.71 |
Related Companies (Peers) to Rashtriya Chemicals and Fertilizers Limited (RCF)
| Price | 37.30 -0.05 (-0.13%) | 52 Week High | 58.15 |
|---|---|---|---|
| ISIN | INE740V01019 | 52 Week Low | 29.90 |
| Industry | Chemicals: Agricultural | Volume | 27,399 |
| Sector | Process Industries | P/E Ratio TTM | 52.27 |
| Market Cap | 757.2 M | 1 Year Beta | 1.69 |
| Price | 175.35 0.40 (0.23%) | 52 Week High | 242.70 |
|---|---|---|---|
| ISIN | INE298I01015 | 52 Week Low | 126.65 |
| Industry | Chemicals: Agricultural | Volume | 33,725 |
| Sector | Process Industries | P/E Ratio TTM | 15.34 |
| Market Cap | 2.2 B | 1 Year Beta | 0.60 |
| Price | 1,342.10 17.70 (1.34%) | 52 Week High | 2,288.80 |
|---|---|---|---|
| ISIN | INE563J01010 | 52 Week Low | 1,045.00 |
| Industry | Chemicals: Agricultural | Volume | 12,857 |
| Sector | Process Industries | P/E Ratio TTM | 440.48 |
| Market Cap | 25.9 B | 1 Year Beta | 0.76 |

| Price | 7,057.65 -38.75 (-0.55%) | 52 Week High | 9,248.00 |
|---|---|---|---|
| ISIN | INE100A01010 | 52 Week Low | 6,466.75 |
| Industry | Chemicals: Agricultural | Volume | 17,384 |
| Sector | Process Industries | P/E Ratio TTM | 46.00 |
| Market Cap | 209.4 B | 1 Year Beta | 0.95 |
| Price | 5,394.10 133.90 (2.55%) | 52 Week High | 5,450.00 |
|---|---|---|---|
| ISIN | INE462A01022 | 52 Week Low | 3,920.45 |
| Industry | Chemicals: Agricultural | Volume | 29,769 |
| Sector | Process Industries | P/E Ratio TTM | 30.92 |
| Market Cap | 236.3 B | 1 Year Beta | 0.55 |

| Price | 1,212.20 -11.25 (-0.92%) | 52 Week High | 1,726.25 |
|---|---|---|---|
| ISIN | INE414D01019 | 52 Week Low | 1,000.00 |
| Industry | Chemicals: Agricultural | Volume | 2,891 |
| Sector | Process Industries | P/E Ratio TTM | |
| Market Cap | 12.7 B | 1 Year Beta | 0.45 |

| Price | 9,219.00 125.60 (1.38%) | 52 Week High | 11,785.00 |
|---|---|---|---|
| ISIN | INE838B01013 | 52 Week Low | 8,280.00 |
| Industry | Chemicals: Agricultural | Volume | 1,129 |
| Sector | Process Industries | P/E Ratio TTM | 40.74 |
| Market Cap | 37.8 B | 1 Year Beta | 0.24 |
| Price | 54.95 -1.05 (-1.87%) | 52 Week High | 206.90 |
|---|---|---|---|
| ISIN | INE802W01023 | 52 Week Low | 43.60 |
| Industry | Chemicals: Agricultural | Volume | 269 |
| Sector | Process Industries | P/E Ratio TTM | |
| Market Cap | 800.6 M | 1 Year Beta | 10.58 |
| Price | 245.30 6.35 (2.66%) | 52 Week High | 665.70 |
|---|---|---|---|
| ISIN | INE032Z01020 | 52 Week Low | 92.15 |
| Industry | Chemicals: Agricultural | Volume | 12,980 |
| Sector | Process Industries | P/E Ratio TTM | 127.76 |
| Market Cap | 25.1 B | 1 Year Beta | -0.80 |
| Price | 624.25 12.10 (1.98%) | 52 Week High | 1,062.00 |
|---|---|---|---|
| ISIN | INE501A01019 | 52 Week Low | 512.40 |
| Industry | Chemicals: Agricultural | Volume | 354.9 T |
| Sector | Process Industries | P/E Ratio TTM | 8.81 |
| Market Cap | 77.3 B | 1 Year Beta | 2.37 |
| Price | 218.75 7.50 (3.55%) | 52 Week High | 273.00 |
|---|---|---|---|
| ISIN | INE00OQ01016 | 52 Week Low | 137.00 |
| Industry | Chemicals: Agricultural | Volume | 165 T |
| Sector | Process Industries | P/E Ratio TTM | |
| Market Cap | 7.1 B | 1 Year Beta | 0.99 |
| Price | 534.55 4.70 (0.89%) | 52 Week High | 670.00 |
|---|---|---|---|
| ISIN | INE126A01031 | 52 Week Low | 433.20 |
| Industry | Chemicals: Agricultural | Volume | 310.1 T |
| Sector | Process Industries | P/E Ratio TTM | 12.20 |
| Market Cap | 94.1 B | 1 Year Beta | 1.01 |
| Price | 889.60 -0.05 (-0.01%) | 52 Week High | 1,324.55 |
|---|---|---|---|
| ISIN | INE369A01029 | 52 Week Low | 752.00 |
| Industry | Chemicals: Agricultural | Volume | 6,111 |
| Sector | Process Industries | P/E Ratio TTM | 22.93 |
| Market Cap | 11.2 B | 1 Year Beta | 1.20 |
| Price | 537.90 12.55 (2.39%) | 52 Week High | 576.70 |
|---|---|---|---|
| ISIN | INE188A01015 | 52 Week Low | 104.00 |
| Industry | Chemicals: Agricultural | Volume | 1.8 M |
| Sector | Process Industries | P/E Ratio TTM | 63.54 |
| Market Cap | 339.6 B | 1 Year Beta | 1.91 |
| Price | 167.70 -0.50 (-0.30%) | 52 Week High | 193.45 |
|---|---|---|---|
| ISIN | INE026A01025 | 52 Week Low | 116.00 |
| Industry | Chemicals: Agricultural | Volume | 1 M |
| Sector | Process Industries | P/E Ratio TTM | 6.47 |
| Market Cap | 67 B | 1 Year Beta | 1.45 |
| Price | 372.25 1.85 (0.50%) | 52 Week High | 561.95 |
|---|---|---|---|
| ISIN | INE694N01015 | 52 Week Low | 265.00 |
| Industry | Chemicals: Agricultural | Volume | 31,783 |
| Sector | Process Industries | P/E Ratio TTM | 22.80 |
| Market Cap | 14.8 B | 1 Year Beta | -0.10 |
| Price | 296.35 -2.50 (-0.84%) | 52 Week High | 314.15 |
|---|---|---|---|
| ISIN | INE0D6701023 | 52 Week Low | 197.45 |
| Industry | Chemicals: Agricultural | Volume | 2.8 M |
| Sector | Process Industries | P/E Ratio TTM | 29.05 |
| Market Cap | 34.5 B | 1 Year Beta | 1.14 |
| Price | 472.05 -1.35 (-0.29%) | 52 Week High | 792.00 |
|---|---|---|---|
| ISIN | INE070I01018 | 52 Week Low | 414.05 |
| Industry | Chemicals: Agricultural | Volume | 20,710 |
| Sector | Process Industries | P/E Ratio TTM | 25.85 |
| Market Cap | 14 B | 1 Year Beta | 0.33 |
| Price | 66.20 -0.40 (-0.60%) | 52 Week High | 85.45 |
|---|---|---|---|
| ISIN | INE745B01028 | 52 Week Low | 56.30 |
| Industry | Chemicals: Agricultural | Volume | 76,953 |
| Sector | Process Industries | P/E Ratio TTM | 22.96 |
| Market Cap | 6.4 B | 1 Year Beta | 1.21 |
| Price | 472.50 36.55 (8.38%) | 52 Week High | 559.40 |
|---|---|---|---|
| ISIN | INE506W01012 | 52 Week Low | 321.00 |
| Industry | Chemicals: Agricultural | Volume | 254.9 T |
| Sector | Process Industries | P/E Ratio TTM | 44.92 |
| Market Cap | 12.9 B | 1 Year Beta | 0.33 |
| Price | 628.70 21.85 (3.60%) | 52 Week High | 694.70 |
|---|---|---|---|
| ISIN | INE900L01010 | 52 Week Low | 430.02 |
| Industry | Chemicals: Agricultural | Volume | 21,415 |
| Sector | Process Industries | P/E Ratio TTM | 26.80 |
| Market Cap | 26.6 B | 1 Year Beta | 0.42 |
| Price | 76.35 -0.55 (-0.72%) | 52 Week High | 96.45 |
|---|---|---|---|
| ISIN | INE414A01015 | 52 Week Low | 44.00 |
| Industry | Chemicals: Agricultural | Volume | 778 T |
| Sector | Process Industries | P/E Ratio TTM | 13.99 |
| Market Cap | 12.4 B | 1 Year Beta | 1.13 |
| Price | 109.75 2.00 (1.86%) | 52 Week High | 131.85 |
|---|---|---|---|
| ISIN | INE558B01017 | 52 Week Low | 72.70 |
| Industry | Chemicals: Agricultural | Volume | 323.5 T |
| Sector | Process Industries | P/E Ratio TTM | 8.07 |
| Market Cap | 12.8 B | 1 Year Beta | -0.81 |
| Price | 1,063.85 -19.95 (-1.84%) | 52 Week High | 1,736.00 |
|---|---|---|---|
| ISIN | INE071N01016 | 52 Week Low | 815.00 |
| Industry | Chemicals: Agricultural | Volume | 146,962 |
| Sector | Process Industries | P/E Ratio TTM | 15.96 |
| Market Cap | 45.1 B | 1 Year Beta | 0.95 |
| Price | 81.85 0.85 (1.05%) | 52 Week High | 110.75 |
|---|---|---|---|
| ISIN | INE295D01020 | 52 Week Low | 71.85 |
| Industry | Chemicals: Agricultural | Volume | 184.6 T |
| Sector | Process Industries | P/E Ratio TTM | 38.89 |
| Market Cap | 16.1 B | 1 Year Beta | 1.66 |
| Price | 8.55 -0.05 (-0.58%) | 52 Week High | 13.55 |
|---|---|---|---|
| ISIN | INE454M01024 | 52 Week Low | 7.30 |
| Industry | Chemicals: Agricultural | Volume | 1.3 M |
| Sector | Process Industries | P/E Ratio TTM | |
| Market Cap | 5.2 B | 1 Year Beta | 0.04 |
| Price | 72.70 -1.45 (-1.96%) | 52 Week High | 89.70 |
|---|---|---|---|
| ISIN | INE870D01012 | 52 Week Low | 46.30 |
| Industry | Chemicals: Agricultural | Volume | 4.3 M |
| Sector | Process Industries | P/E Ratio TTM | 16.87 |
| Market Cap | 36.4 B | 1 Year Beta | 1.75 |
| Price | 71.15 -0.85 (-1.18%) | 52 Week High | 75.40 |
|---|---|---|---|
| ISIN | INE088F01024 | 52 Week Low | 48.30 |
| Industry | Chemicals: Agricultural | Volume | 1.6 M |
| Sector | Process Industries | P/E Ratio TTM | 45.94 |
| Market Cap | 58.7 B | 1 Year Beta | 0.81 |
| Price | 1,092.90 -0.40 (-0.04%) | 52 Week High | 1,279.90 |
|---|---|---|---|
| ISIN | INE277B01014 | 52 Week Low | 727.55 |
| Industry | Chemicals: Agricultural | Volume | 8,699 |
| Sector | Process Industries | P/E Ratio TTM | 21.37 |
| Market Cap | 13.4 B | 1 Year Beta | 0.30 |
| Price | 217.95 -4.40 (-1.98%) | 52 Week High | 270.90 |
|---|---|---|---|
| ISIN | INE613A01020 | 52 Week Low | 186.55 |
| Industry | Chemicals: Agricultural | Volume | 559.3 T |
| Sector | Process Industries | P/E Ratio TTM | 48.46 |
| Market Cap | 43.3 B | 1 Year Beta | 1.29 |
| Price | 237.50 -3.15 (-1.31%) | 52 Week High | 318.75 |
|---|---|---|---|
| ISIN | INE809A01024 | 52 Week Low | 169.80 |
| Industry | Chemicals: Agricultural | Volume | 60,641 |
| Sector | Process Industries | P/E Ratio TTM | 16.29 |
| Market Cap | 4.3 B | 1 Year Beta | 1.53 |
| Price | 697.25 -2.35 (-0.34%) | 52 Week High | 943.45 |
|---|---|---|---|
| ISIN | INE788J01021 | 52 Week Low | 619.95 |
| Industry | Chemicals: Agricultural | Volume | 5,691 |
| Sector | Process Industries | P/E Ratio TTM | 56.91 |
| Market Cap | 10.4 B | 1 Year Beta | 0.80 |
| Price | 58.95 -0.40 (-0.67%) | 52 Week High | 138.40 |
|---|---|---|---|
| ISIN | INE112X01017 | 52 Week Low | 54.55 |
| Industry | Chemicals: Agricultural | Volume | 12,363 |
| Sector | Process Industries | P/E Ratio TTM | 33.24 |
| Market Cap | 997.1 M | 1 Year Beta | 0.54 |
| Price | 73.15 0.45 (0.62%) | 52 Week High | 92.00 |
|---|---|---|---|
| ISIN | INE147A01011 | 52 Week Low | 51.50 |
| Industry | Chemicals: Agricultural | Volume | 1 M |
| Sector | Process Industries | P/E Ratio TTM | 5.31 |
| Market Cap | 14.8 B | 1 Year Beta | 2.73 |
| Price | 416.90 -6.00 (-1.42%) | 52 Week High | 540.80 |
|---|---|---|---|
| ISIN | INE258G01013 | 52 Week Low | 382.00 |
| Industry | Chemicals: Agricultural | Volume | 153.5 T |
| Sector | Process Industries | P/E Ratio TTM | 48.88 |
| Market Cap | 210.7 B | 1 Year Beta | 0.17 |
| Price | 1,035.80 1.00 (0.10%) | 52 Week High | 1,214.90 |
|---|---|---|---|
| ISIN | INE092A01019 | 52 Week Low | 876.80 |
| Industry | Chemicals: Agricultural | Volume | 486.8 T |
| Sector | Process Industries | P/E Ratio TTM | 11.68 |
| Market Cap | 263.6 B | 1 Year Beta | 1.10 |
| Price | 614.80 -10.25 (-1.64%) | 52 Week High | 807.00 |
|---|---|---|---|
| ISIN | INE628A01036 | 52 Week Low | 576.95 |
| Industry | Chemicals: Agricultural | Volume | 1.9 M |
| Sector | Process Industries | P/E Ratio TTM | 16.13 |
| Market Cap | 469.1 B | 1 Year Beta | 0.93 |
| Price | 155.25 -0.35 (-0.22%) | 52 Week High | 197.65 |
|---|---|---|---|
| ISIN | INE840M01016 | 52 Week Low | 116.00 |
| Industry | Chemicals: Agricultural | Volume | 85,085 |
| Sector | Process Industries | P/E Ratio TTM | |
| Market Cap | 6.5 B | 1 Year Beta | 1.86 |
Rashtriya Chemicals and Fertilizers Limited (RCF) Related Indices
Stock Sectors
- 52Commercial Services
- 13Communications
- 72Consumer Durables
- 111Consumer Non-Durables
- 81Consumer Services
- 33Distribution Services
- 49Electronic Technology
- 18Energy Minerals
- 245Finance
- 20Health Services
- 95Health Technology
- 85Industrial Services
- 2Miscellaneous
- 134Non-Energy Minerals
- 357Process Industries
- 270Producer Manufacturing
- 31Retail Trade
- 103Technology Services
- 41Transportation
- 38Utilities
Stock Industries
- 3Advertising/Marketing Services
- 7Aerospace & Defense
- 62Agricultural Commodities/Milling
- 14Air Freight/Couriers
- 3Airlines
- 6Alternative Power Generation
- 4Aluminum
- 39Apparel/Footwear
- 9Apparel/Footwear Retail
- 64Auto Parts: OEM
- 11Automotive Aftermarket
- 9Beverages: Alcoholic
- 1Beverages: Non-Alcoholic
- 1Biotechnology
- 12Broadcasting
- 17Building Products
- 4Cable/Satellite TV
- 1Catalog/Specialty Distribution
- 40Chemicals: Agricultural
- 18Chemicals: Major Diversified
- 75Chemicals: Specialty
- 3Coal
- 4Commercial Printing/Forms
- 1Computer Communications
- 4Computer Peripherals
- 37Construction Materials
- 3Consumer Sundries
- 25Containers/Packaging
- 2Contract Drilling
- 5Data Processing Services
- 1Department Stores
- 1Drugstore Chains
- 25Electric Utilities
- 46Electrical Products
- 3Electronic Components
- 9Electronic Equipment/Instruments
- 11Electronic Production Equipment
- 4Electronics Distributors
- 1Electronics/Appliance Stores
- 9Electronics/Appliances
- 75Engineering & Construction
- 1Environmental Services
- 55Finance/Rental/Leasing
- 28Financial Conglomerates
- 3Financial Publishing/Services
- 3Food Distributors
- 3Food Retail
- 7Food: Major Diversified
- 7Food: Meat/Fish/Dairy
- 28Food: Specialty/Candy
- 9Forest Products
- 7Gas Distributors
- 10Home Furnishings
- 1Home Improvement Chains
- 7Homebuilding
- 13Hospital/Nursing Management
- 18Hotels/Resorts/Cruise lines
- 14Household/Personal Care
- 9Industrial Conglomerates
- 51Industrial Machinery
- 35Industrial Specialties
- 54Information Technology Services
- 3Integrated Oil
- 7Internet Retail
- 11Internet Software/Services
- 43Investment Banks/Brokers
- 16Investment Managers
- 1Investment Trusts/Mutual Funds
- 6Life/Health Insurance
- 18Major Banks
- 6Major Telecommunications
- 6Marine Shipping
- 1Medical Distributors
- 2Medical Specialties
- 7Medical/Nursing Services
- 32Metal Fabrication
- 1Miscellaneous
- 39Miscellaneous Commercial Services
- 24Miscellaneous Manufacturing
- 14Motor Vehicles
- 21Movies/Entertainment
- 4Multi-Line Insurance
- 3Office Equipment/Supplies
- 1Oil & Gas Pipelines
- 1Oil & Gas Production
- 11Oil Refining/Marketing
- 6Oilfield Services/Equipment
- 7Other Consumer Services
- 20Other Consumer Specialties
- 19Other Metals/Minerals
- 10Other Transportation
- 33Packaged Software
- 3Personnel Services
- 2Pharmaceuticals: Generic
- 84Pharmaceuticals: Major
- 6Pharmaceuticals: Other
- 1Precious Metals
- 4Publishing: Books/Magazines
- 7Publishing: Newspapers
- 18Pulp & Paper
- 1Railroads
- 51Real Estate Development
- 22Regional Banks
- 8Restaurants
- 3Semiconductors
- 2Specialty Insurance
- 7Specialty Stores
- 5Specialty Telecommunications
- 64Steel
- 11Telecommunications Equipment
- 84Textiles
- 3Tobacco
- 1Tools & Hardware
- 7Trucking
- 24Trucks/Construction/Farm Machinery
- 25Wholesale Distributors
- 2Wireless Telecommunications
Leave a Reply